Featured News
Free NVIDIA FCAT VR Performance Analysis Tool Available Now For Download
In 2013 NVIDIA revolutionized graphics card benchmarking with the release of FCAT, a free tool that enabled gamers and reviewers to test not only FPS, but also the smoothness and quality of gameplay on all GPUs. With FCAT, performance could for the first time be measured in intricate detail, revealing micro-stutters, dropped frames, incorrect multi-GPU framepacing, and much more. Now, the best GPUs are those that are fast and smooth, giving gamers a far more enjoyable experience in every game.
Today we’re releasing FCAT VR, enabling reviewers, game developers, hardware manufacturers, and enthusiasts to reliably test the performance of Virtual Reality PC games, where fast, smooth performance prevents stuttery unresponsive gameplay, which can lead to eye strain and discomfort.
Before now, Virtual Reality testing relied on general benchmarking tools, synthetic tests, and hacked-together solutions, which failed to reveal the true performance of GPUs in VR games. With FCAT VR, we read performance data from NVIDIA driver stats, Event Tracing for Windows (ETW) events for Oculus Rift, and SteamVR’s performance API data for HTC Vive to generate precise VR performance data on all GPUs.
Using this data FCAT VR users can create charts and analyze data for frametimes, dropped frames, runtime warp dropped frames, and Asynchronous Space Warp (ASW) synthesized frames, revealing stutters, interpolation, and the experience received when gaming on any GPU in the tested Virtual Reality game.
 An example of the VR FCAT’s performance charts
If you wish to benchmark a system with FCAT VR the testing itself is straightforward, though setting up analysis of benchmark data does require a few steps. How-To Guides for all steps, along with additional information that will give you greater insight into FCAT VR testing, can be accessed below.
Guide Contents:
- FCAT VR Testing, In Depth
- FCAT VR Installation
- Unpack “FCAT VR Capture”
- Installation of FCAT VR Capture On HTC Vive
- Installation of FCAT VR Capture On Oculus Rift
- Unpack “FCAT VR Analyzer”
- Installing Anaconda & pyqtgraph For FCAT VR Analyzer
- How To Use FCAT VR Capture
- How To Analyze Captured FCAT VR Data with FCAT VR Analyzer
- Recommended Games For First-Time VR FCAT Benchmarking
- NVIDIA VRWorks Overview
- NVIDIA VRWorks Benchmarks With FCAT VR
- Everest VR
- NVIDIA VR Funhouse
- Sports Bar VR
- Raw Data
- Serious Sam VR: The Last Hope
- Trials on Tatooine
- Conclusion
FCAT VR Testing, In Depth
Today’s leading high-end VR headsets, the Oculus Rift and HTC Vive, both refresh their screen at a fixed interval of 90 Hz, which equates to one screen refresh every ~11.1 milliseconds (ms). VSYNC is enabled to prevent tearing, since tearing in the HMD can cause major discomfort to the user.
VR software for delivering frames can be divided into two parts: the VR Game and the VR Runtime. When timing requirements are satisfied and the process works correctly, the following sequence is observed:
- The VR Game samples the current headset position sensor and updates the camera position in a game to correctly track a user’s head position.
- The game then establishes a graphics frame, and the GPU renders the new frame to a texture (not the final display).
- The VR Runtime reads the new texture, modifies it, and generates a final image that is displayed on the headset display. Two of these interesting modifications include color correction and lens correction, but the work done by the VR Runtime can be much more elaborate.
The following figure shows what this looks like in a timing chart.
Ideal VR Pipeline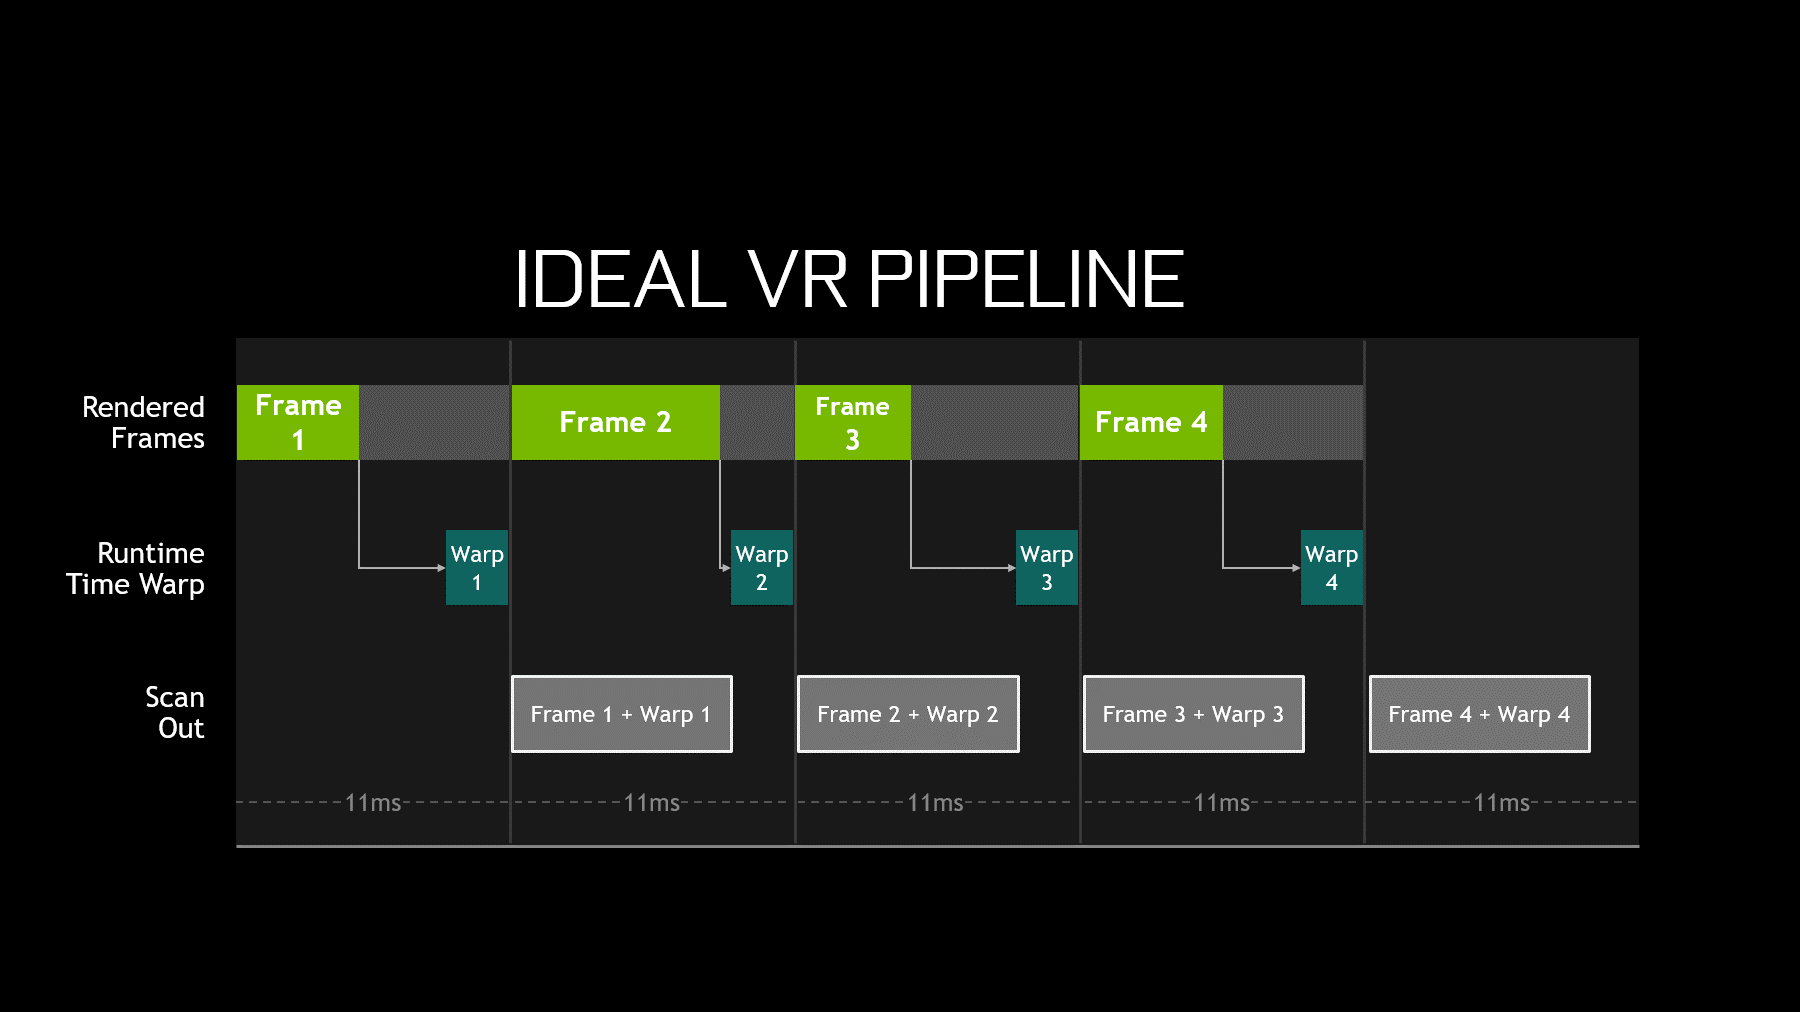
The job of the Runtime becomes significantly more complex if the time to generate a frame exceeds the refresh interval. In that case, the total elapsed time for the combined VR Game and VR Runtime is too long, and the frame will not be ready to display at the beginning of the next scan.
In this case, the HMD would typically redisplay the prior rendered frame from the Runtime, but for VR that experience is unacceptable because repeating an old frame on a VR headset display ignores head motion and results in a poor user experience.
Runtimes use a variety of techniques to improve this situation, including algorithms that synthesize a new frame rather than repeat the old one. Most of the techniques center on the idea of reprojection, which uses the most recent head sensor location input to adjust the old frame to match the current head position. This does not improve the animation embedded in a frame—which will suffer from a lower frame rate and judder—but a more fluid visual experience that tracks better with head motion is presented in the HMD.
FCAT VR Capture captures four key performance metrics for Rift and Vive:
- Dropped Frames (also known as App Miss or App Drop)
- Warp Misses
- Frametime data
- Asynchronous Space Warp (ASW) synthesized frames

Whenever the frame rendered by the VR Game arrives too late to be displayed in the current refresh interval, a Frame Drop occurs and causes the game to stutter. Understanding these drops and measuring them provides insight into VR performance.
Synthesized Frame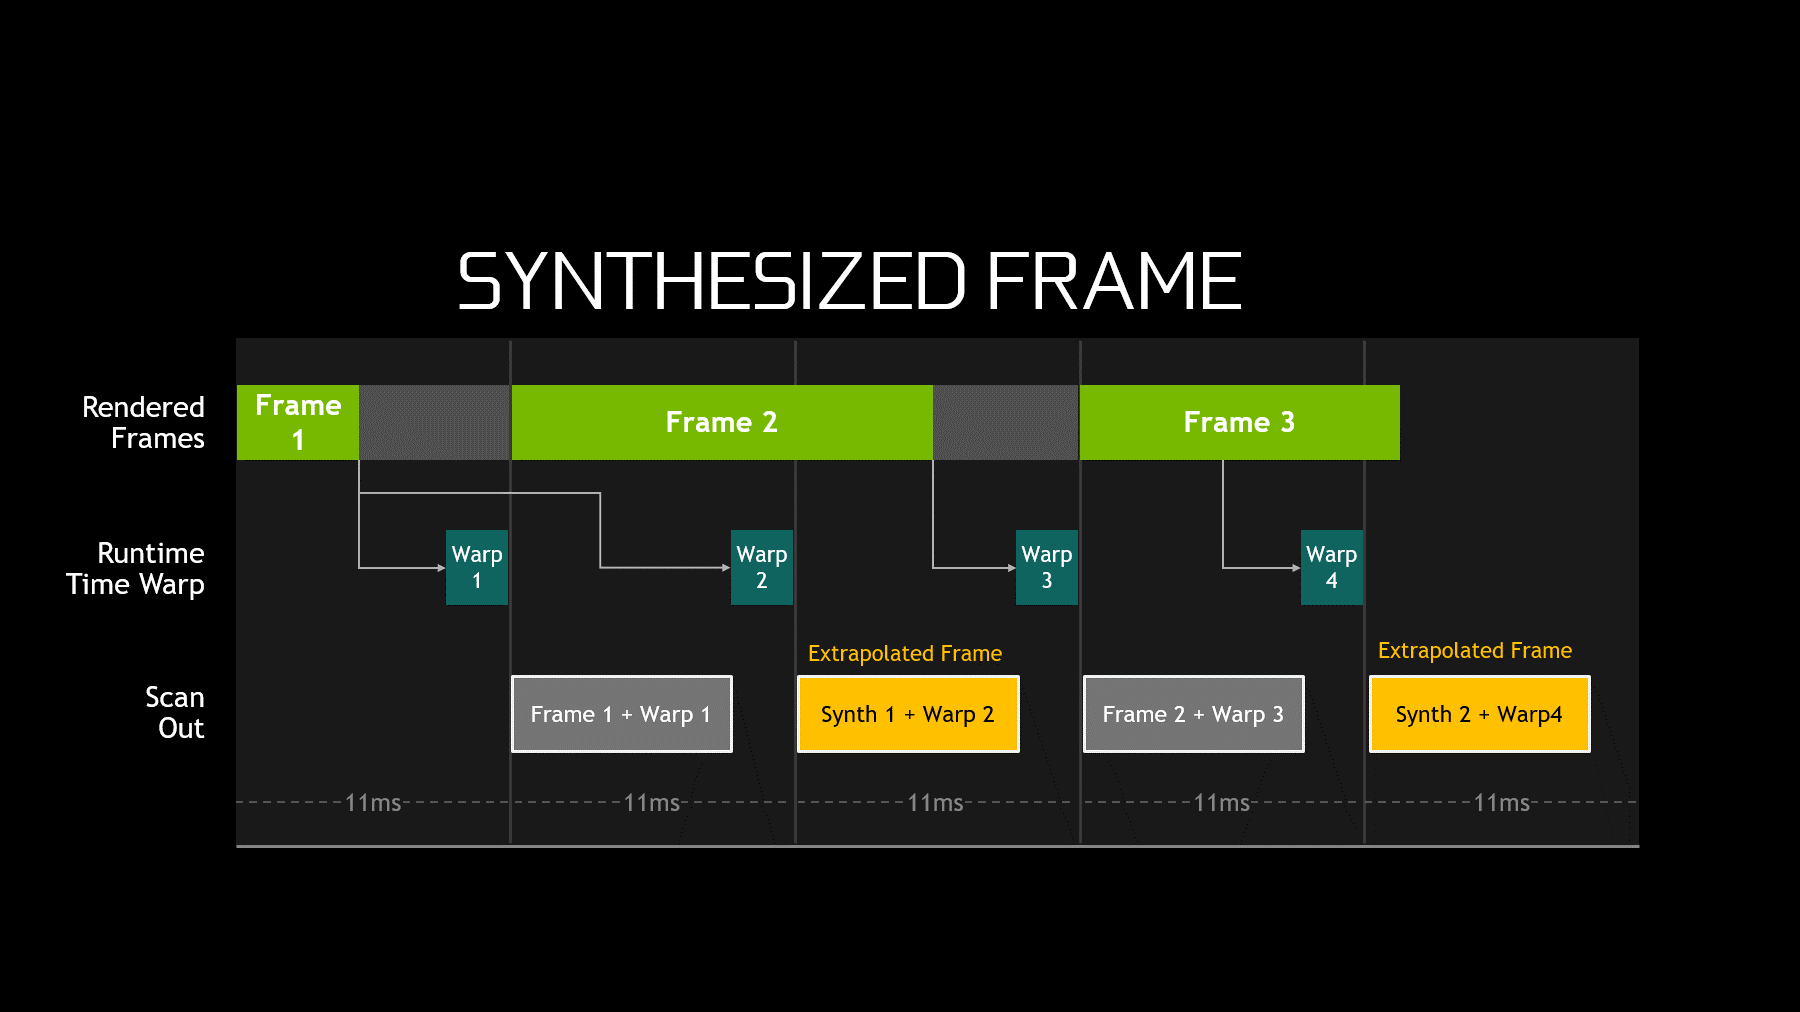
Synthesized Frames: Asynchronous Spacewarp (ASW) is a process that applies animation detection from previously rendered frames in order to synthesize a new, predicted frame.
See the Asynchronous Spacewarp (ASW) section below for more information on how it works.
Warp Misses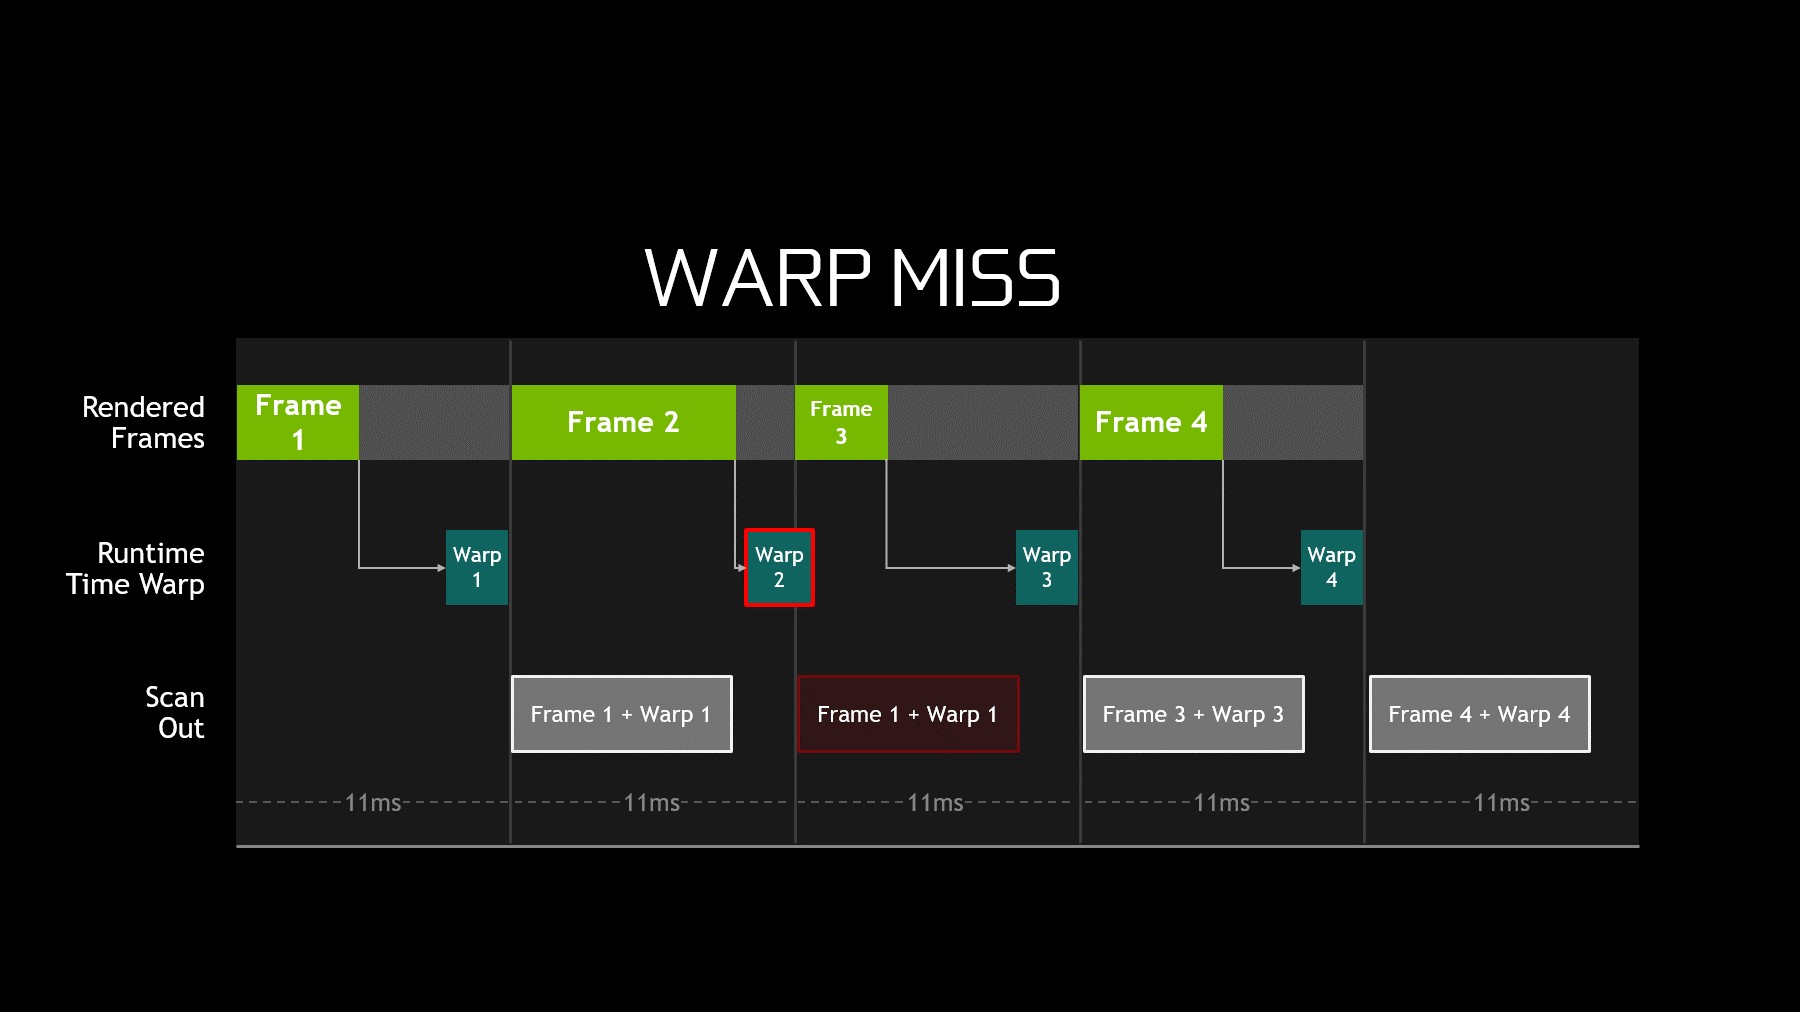
Warp misses are a more significant issue for the VR experience. A warp miss occurs whenever the runtime fails to produce a new frame (or a reprojected frame) in the current refresh interval. In the preceding figure, a prior warped frame is reshown by the GPU. The VR user experiences this frozen time as a significant stutter.
FrameTimeSince FCAT VR provides detailed timing, it is also possible to accurately measure unconstrained FPS for any title. By examining how long the system takes to render each frame, we see just how quickly the system could have displayed that frame if not for the fixed 90 Hz refresh cadence. By using this information, FCAT VR Capture looks inside the frame to calculate estimated headroom and is able to truly measure relative GPU performance of demanding VR content within the fixed refresh VR ecosystem.
Oculus Rift Testing With FCAT VR
FCAT VR Capture directly accesses performance information provided by the Oculus runtime logged to ETW. When the hotkey is pressed, FCAT VR Capture captures the required events on the fly, converts these events into readable timestamps, and then logs it to a CSV file.
The following timestamps are generated today with Oculus:
- App Render Begin
- App Render Completion
- App Miss
- Warp Render Begin
- Warp Render Completion
- Warp Miss
The current SDK version support is <= 1.11.
Oculus — FCAT VR Capture Columns ExplainedThe table below shows FCAT VR Capture columns and corresponding Oculus events.
NOTE: N/A represents “Not Available”, and some ETW events do not have fields.
| FCAT VR Capture Fields | Units | Oculus Event Name (id) | Oculus Event Field | Description |
| Frame Index | integer counter | Return(1) and EndFrameAppTiming(44) | FrameID from Return event and FrameIndex from EndFrameAppTiming event | Game specifies this frame index in ovr_SubmitFrame. |
| Game Start | milliseconds, absolute | PhaseSyncEnd(36) | BeginFrameTime | Timestamp when Game starts preparing frame. |
| Game Complete CPU | milliseconds, absolute | PhaseSyncEnd(36) | EndFrameTime | Timestamp when Game has prepared frame (i.e. all CPU side work has been done). |
| Game Complete GPU | milliseconds, absolute | PhaseSyncEnd(36) | CompletionTime | Timestamp when frame finished on GPU. |
| Queue Ahead | milliseconds | PhaseSyncEnd(36) | QueueAhead | Amount of queue ahead that was allowed for the frame. For adaptive queue ahead please refer to following link: https://developer.oculus.com /documentation/pcsdk /latest/concepts/dg-render /#dg-queue-ahead. |
| Runtime Sample | milliseconds, absolute | CompositionEnd SpinWait(53) |
NA - Timestamp when event was generated | Timestamp for warp start. Usually fixed amount of time before VSYNC. |
| Runtime Complete |
milliseconds, absolute | CompositionEnd(49) |
NA - Timestamp when event was generated |
Warp finished on GPU. |
| VSYNC |
milliseconds, absolute | NV specific event, not available on non-NV HW |
NA - Timestamp when event was generated |
VSYNC interrupt for HMD (NVIDIA only). |
| App Miss |
integer counter | ClientFrameMissed(47) |
Not used |
Incremented for each ClientFrameMissed event and reset after warp complete event |
| Warp Miss |
integer counter | CompositionMissed |
Not used |
N/A |
| ASW Status |
binary 0 or 1 | Computed value based on call(0) and return(1) events |
Call(0) Return (1) |
Call(0) and Return(1) events contain FrameID field. Interpolated FrameID’s are 0, if interpolated frames are present, ASW status is reported as 1, otherwise 0. |
Asynchronous Spacewarp (ASW)
Asynchronous Spacewarp (ASW) is a technology developed by Oculus aimed at improving smoothness on mainstream GPUs. At this time, ASW is enabled by default in the 1.10 BETA public runtime.
How does ASW Work?In order to understand ASW, we must first understand Asynchronous Timewarp (ATW). ATW is a process that is separate from the main rendering thread and runs within the Oculus Runtime where the HMD position is sampled very close to the VSYNC interval, the difference from the previous position is calculated, the most recently completed frame is translated (shifted without full re-rendering) based on the position difference, and the new translated frame is displayed on the HMD.
Asynchronous Spacewarp (ASW) is a process that applies animation detection from previously rendered frames in order to synthesize a new, predicted frame. Colloquially, we can refer to this as an ASW synthesized frame.
If the application is able to consistently render at 90 Hz, the synthesized frames are never displayed in the HMD. ASW is “activated” when a frame cannot be rendered as per usual, on time. Predicting a synthesized frame based on motion detection from previously rendered frames is less demanding than rendering a new frame.
If ASW is disabled and an application fails to submit frames to the Oculus Runtime at 90 Hz, the Runtime will select the most recently completed frame and apply ATW to it.
If ASW is enabled and an application fails to submit frames to the Oculus Runtime at 90 Hz, the Runtime renders the application at 45 FPS and applies ATW to both regularly rendered frames and ASW synthesized frames. These ASW synthesized frames act as intermediary frames between the regularly rendered frames. The end result is that the viewer sees smoother animation, rendered at 45 FPS, but presented at 90 FPS.
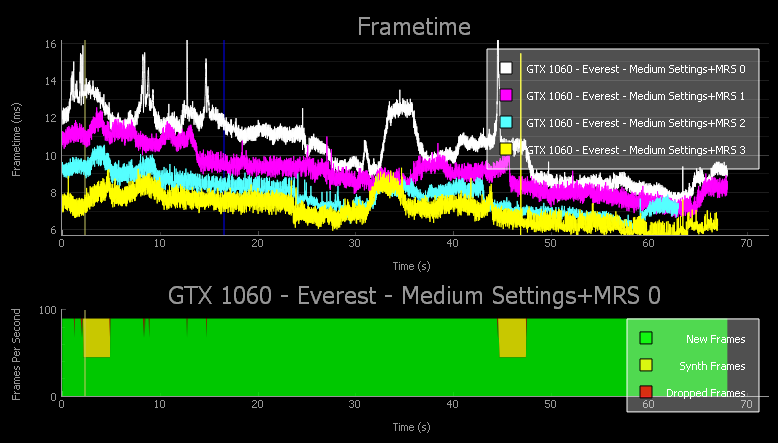
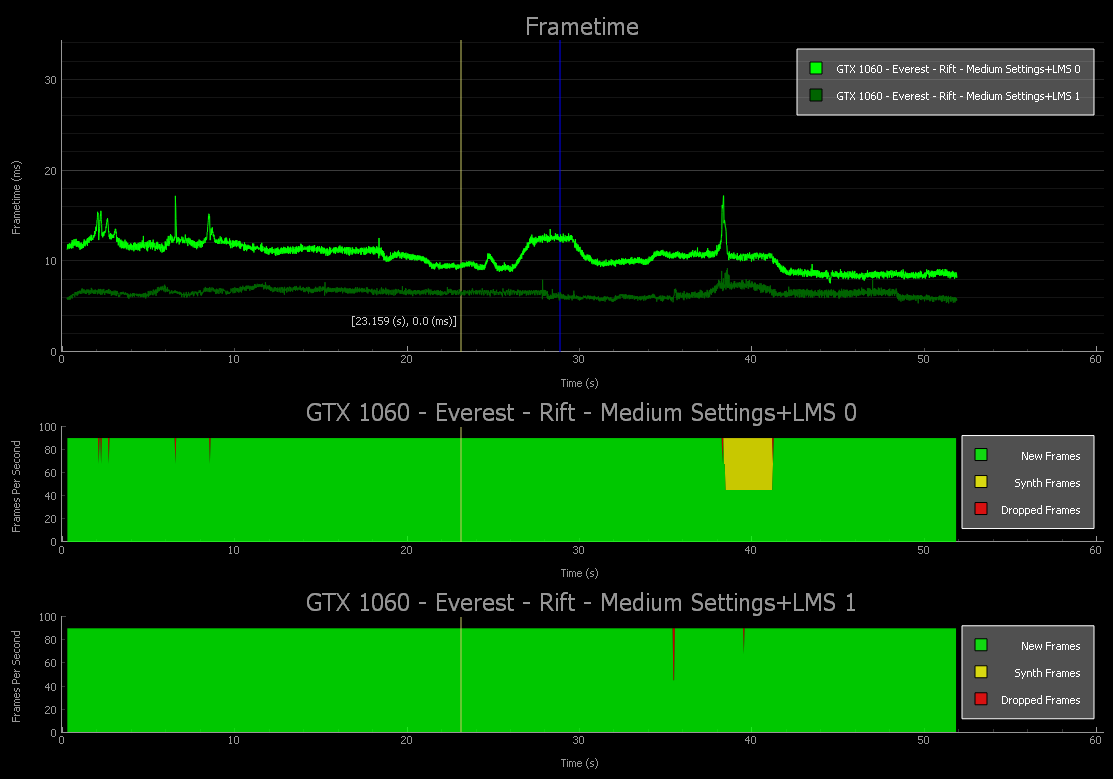
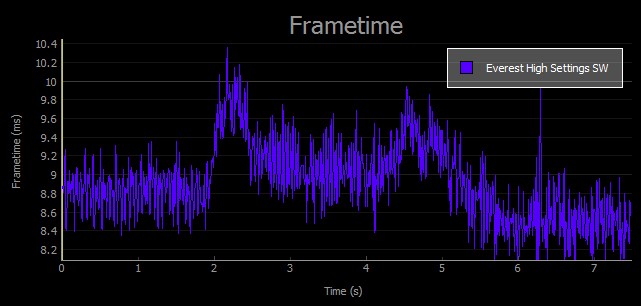
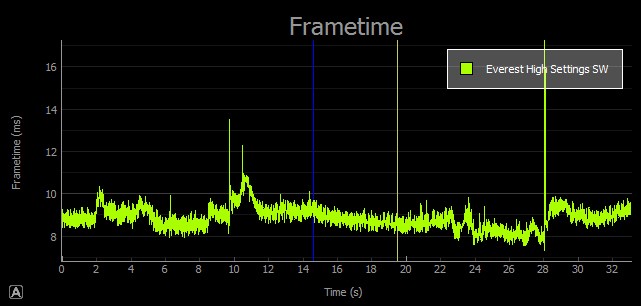
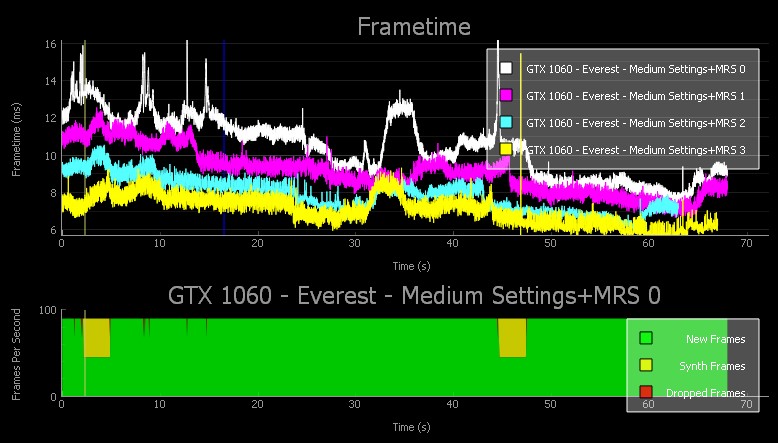
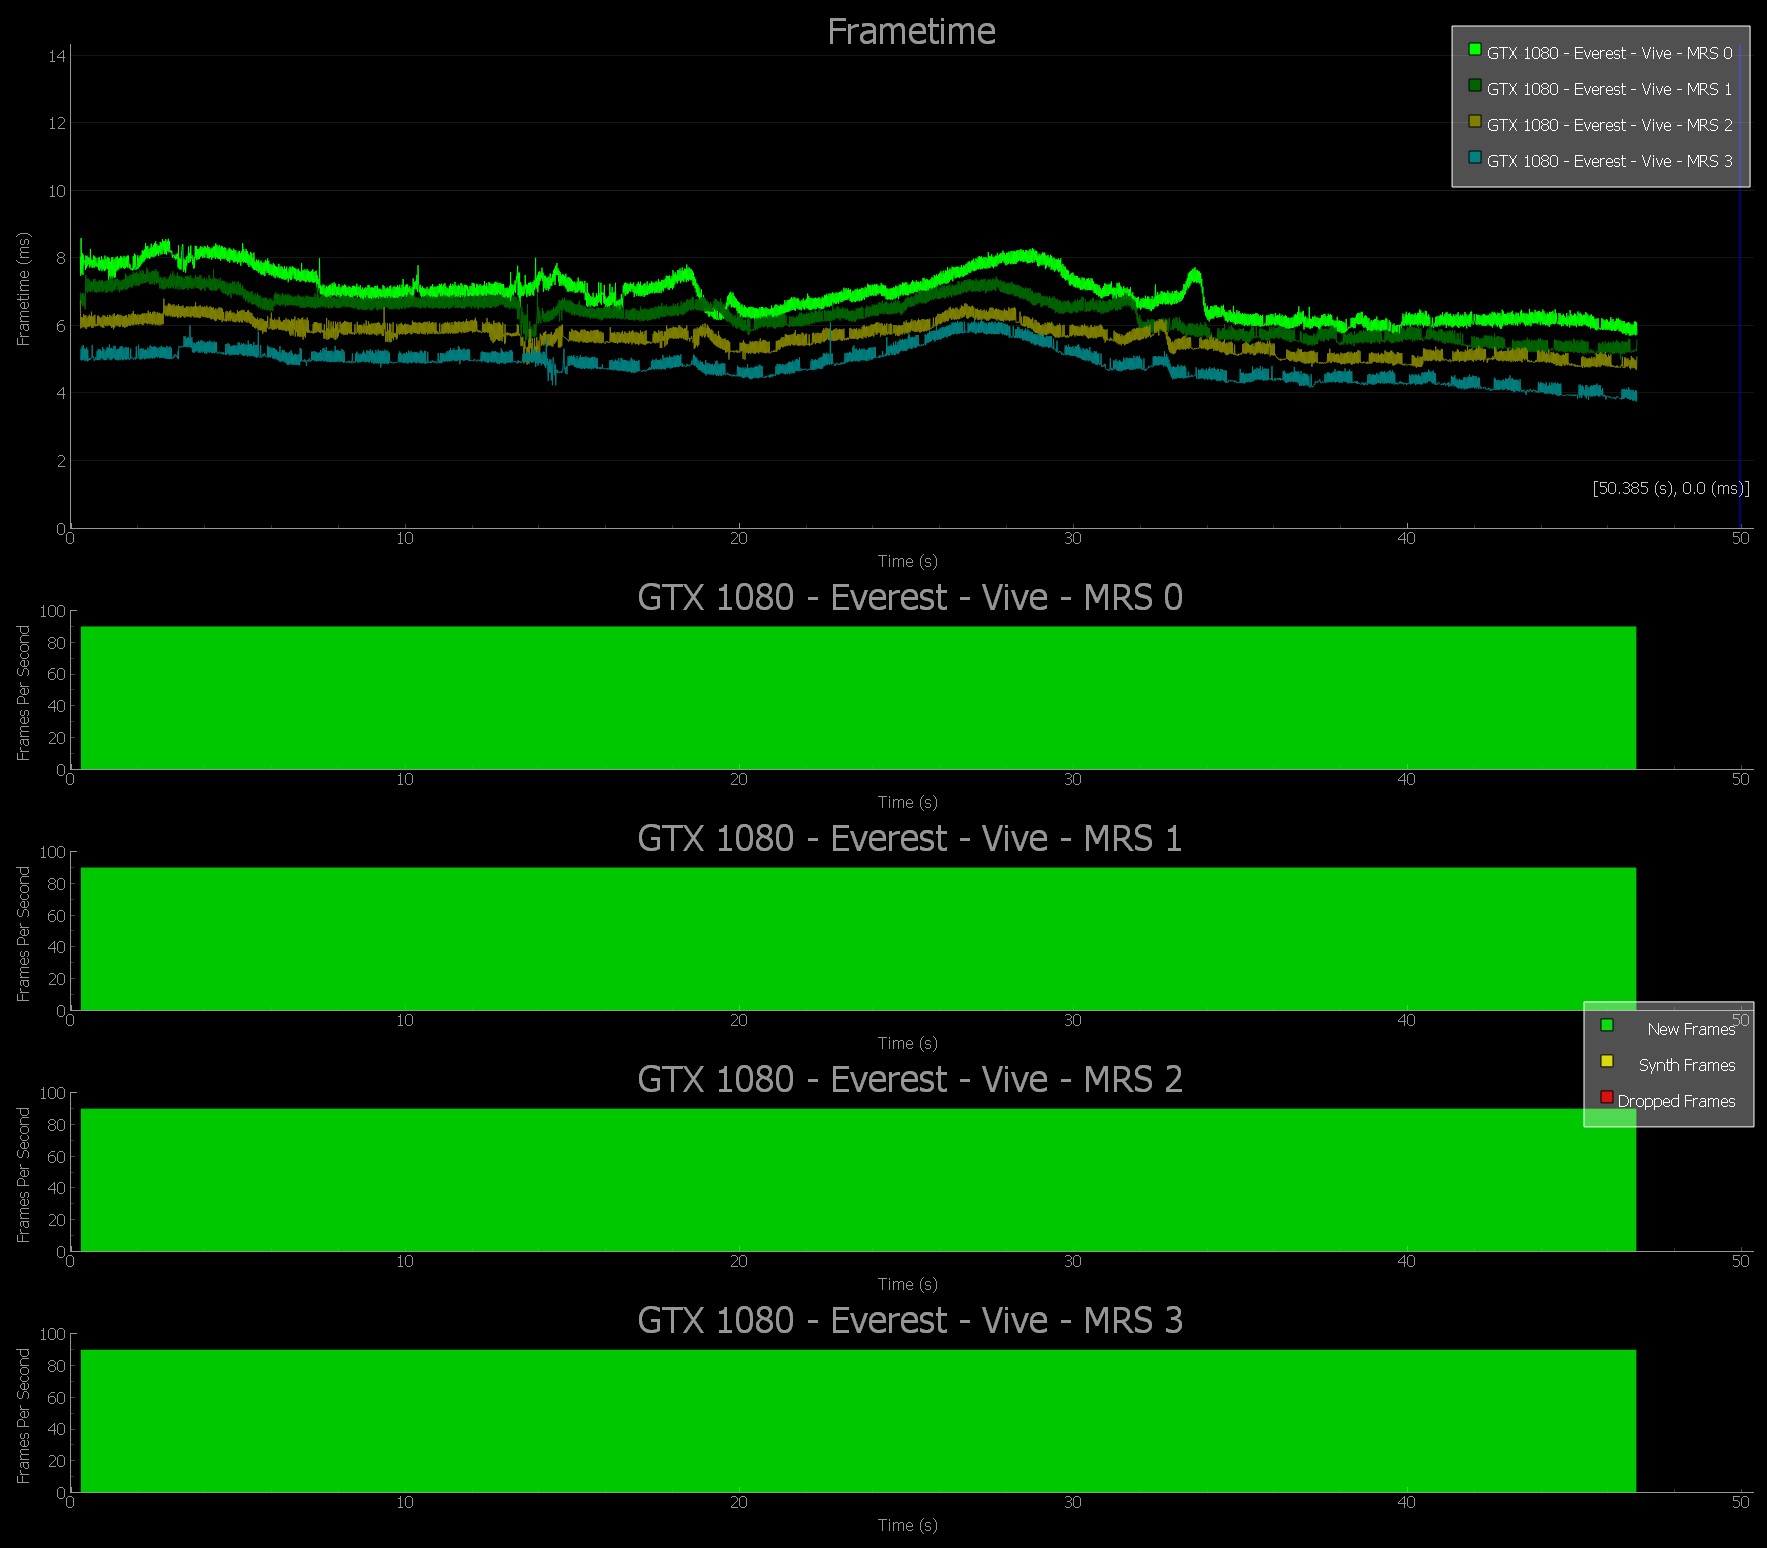
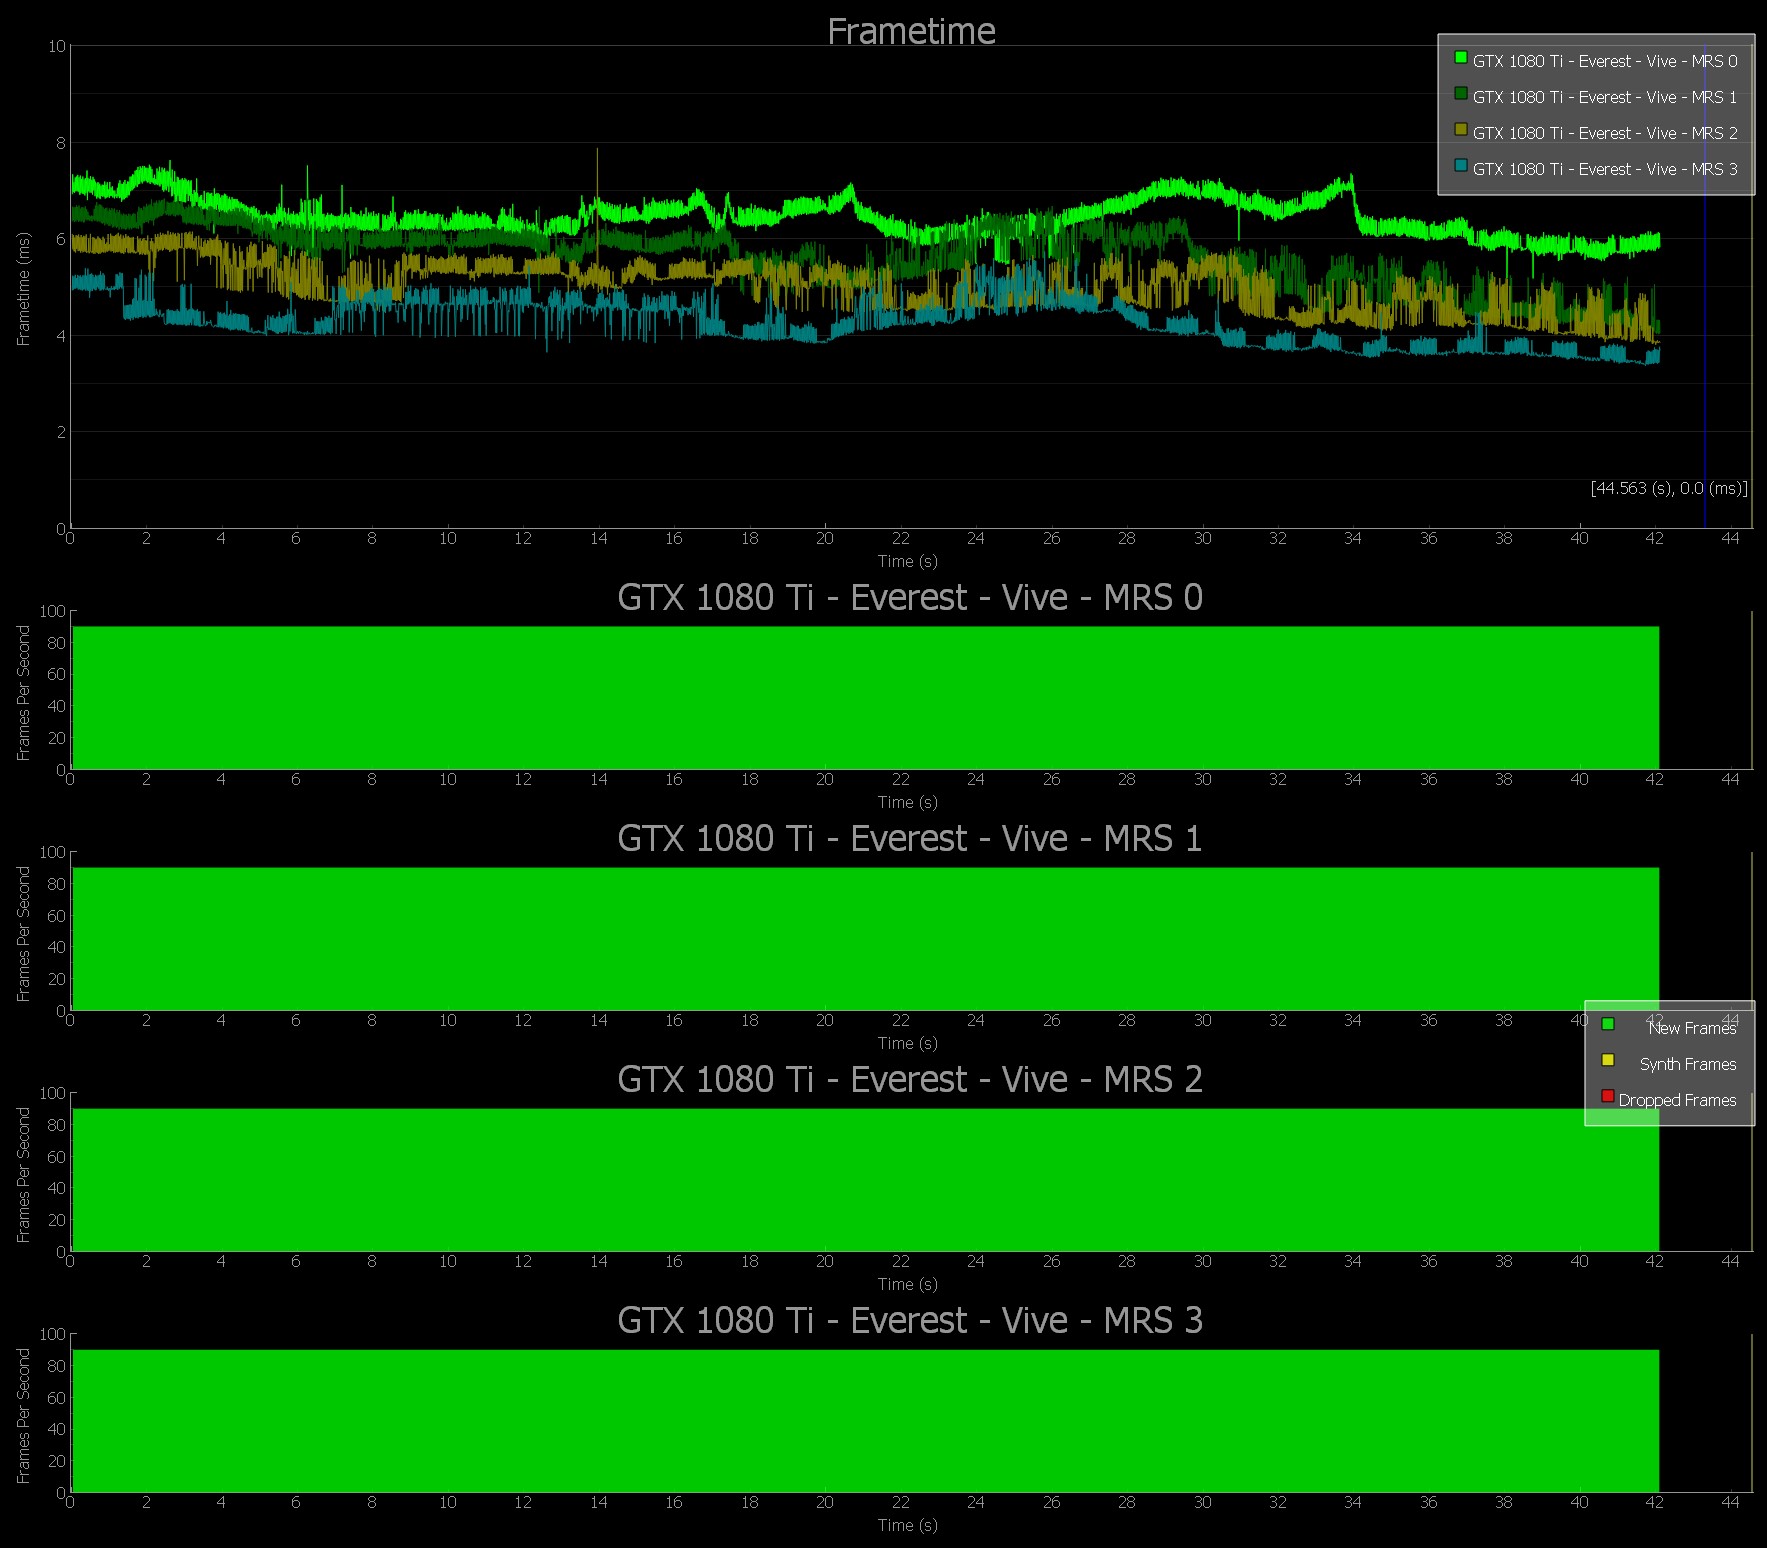
Output GraphsFCAT VR Analyzer generates graphs which clearly show this behavior seen in the HMD. The topmost chart represents the time it took to render the frame which appears in the HMD. The bottom two charts (green rectangles) show dropped frames, synthesized frames, and warp misses (which are shown as dropped frames).

Looking closer at the frametime graph (below), we see a comparison of LMS settings in the game Everest on the Oculus Rift. Notice that the bright-green capture line with LMS set to 0 (Off) usually stays at 11.1 ms, which correlates to 90 FPS. However, there are minor spikes that go above 11ms.

The colors below the frametime graph (green rectangles) represent the instantaneous percentage of frame types within any given second within 90 FPS. This data answers these questions:
- Over the previous second, how many frames were real and fully rendered at 90 FPS?
- How many frames were synthesized instead of fully rendered?
- And how many frames were dropped?
Continuing to look at the Everest data, we see that that the spikes above 11ms resulted in several dropped frames, and a rather large spike at approximately 38-39 seconds, and several synthesized frames over ~5 seconds due to that large spike. However, using NVIDIA LMS (1) fixes most of the issues.
These charts show that FCAT VR Capture allows for a more accurate understanding of what is happening behind the scenes.
A cursory analysis of these graphs can be accomplished by considering how much green is seen in the graph. The greener the graph, the more real frames are presented, and the better the experience.
HTC Vive Testing With FCAT VR
HTC Vive testing uses the SteamVR-based OpenVR SDK. FCAT VR Capture uses a performance API exposed by SteamVR to generate the timestamps in the same format used for Oculus timestamps. When the hotkey is pressed, FCAT VR Capture records these events on the fly, converts these events into readable timestamps, and then logs the event into a CSV file. OpenVR SDK versions 0.5 to 0.19 (both included) are supported.
OpenVR — FCAT VR Capture Columns ExplainedThe following table shows FCAT VR Capture columns and corresponding HTC events.
| FCAT VR Capture Fields | Units | OpenVR Performance API field name | Description |
| Frame Index | integer counter | m_nFrameIndex | |
| Frame Start | milliseconds, absolute | m_flSystemTimeInSeconds | Absolute time reference for comparing frames. This aligns with the VSYNC that running start is relative to. |
| Render End | milliseconds, absolute | m_flSystemTimeInSeconds + m_flPreSubmitGpuMs + m_flPostSubmitGpuMs | Absolute time for render finish on GPU. |
| Warp End | milliseconds, absolute | m_flSystemTimeInSeconds + m_flTotalRenderGpuMs | Absolute time for warp finish on GPU. |
| HMD Sample Start | milliseconds, absolute | m_flSystemTimeInSeconds + m_flWaitGetPosesCalledMs | Absolute time for HMD sample. |
| Number Times Presented | integer counter | m_nNumFramePresents | Number of times this frame was presented. |
| Number Miss Presented | integer counter | m_nNumMisPresented | Number of times this frame was presented on a vsync other than it was originally predicted to. |
| Number Dropped Frames | integer counter | m_nNumDroppedFrames | Number of additional times previous frame was scanned out. |
| Reprojection Flags | integer | m_nReprojectionFlags | 4 - Asynchronous reprojection is enabled. |
| Scene Render GPU Time | milliseconds, | m_flPreSubmitGpuMs | Time spent rendering the scene (GPU work submitted between WaitGetPoses and second Submit). |
| Total GPU Render Time | milliseconds | m_flTotalRenderGpuMs | Time between work submitted immediately after present (ideally VSYNC) until the end of compositor submitted work. |
| Compositor GPU Render Time | milliseconds | m_flCompositorRenderGpuMs | Time spend performing distortion correction, rendering chaperone, overlays, etc. |
| Compositor CPU Render Time | milliseconds | m_flCompositorRenderCpuMs | Time spent on CPU submitting the above work for this frame. |
| Compositor Idle Time | milliseconds | m_flCompositorIdleCpuMs | Time spent waiting for running start (application could have used this much more time). |
| Client Frame Interval | milliseconds | m_flClientFrameIntervalMs | Time between calls to WaitGetPoses. |
| Present Call CPU | milliseconds | m_flPresentCallCpuMs | Time blocked on call to present (usually 0.0, but can go long). |
| Wait for Present CPU | milliseconds | m_flWaitForPresentCpuMs | Time spent spin-waiting for frame index to change (not near-zero indicates wait object failure). |
| Submit Frame | milliseconds | m_flSubmitFrameMs | Time spent in IVRCompositor::Submit (not near-zero indicates driver issue). |
| New Poses Ready | milliseconds | m_flNewPosesReadyMs | |
| New Frame Ready | milliseconds | m_flNewFrameReadyMs | Second call to IVRCompositor::Submit. |
| Compositor Update Start | milliseconds | m_flCompositorUpdateStartMs | |
| Compositor Update End | milliseconds | m_flCompositorUpdateEndMs | |
| Compositor Render Start | milliseconds | m_flCompositorRenderStartMs | |
| ProcessID | integer | Process ID of the Game/Application. | |
| API Version | integer | OpenVR API version. |
Reprojection
SteamVR uses two modes of reprojection:
- Interleaved Reprojection
- Asynchronous Reprojection
Both modes are supported on NVIDIA GPUs and are enabled by default. Reprojection can only correct for rotation, like Oculus’ Asynchronous Time Warp (ATW). Since Asynchronous Reprojection is not supported on AMD’s GPUs, we recommend disabling it on NVIDIA to ensure apples-to-apples testing with AMD competitive GPUs.
For a detailed explanation of Reprojection please refer to the presentation by Alex Vlachos from Valve: https://youtu.be/DdL3WC_oBO4?t=21m52s.
FCAT VR Installation
Begin by downloading the "FCAT VR" .zip from GeForce.com.
Unpack “FCAT VR Capture”
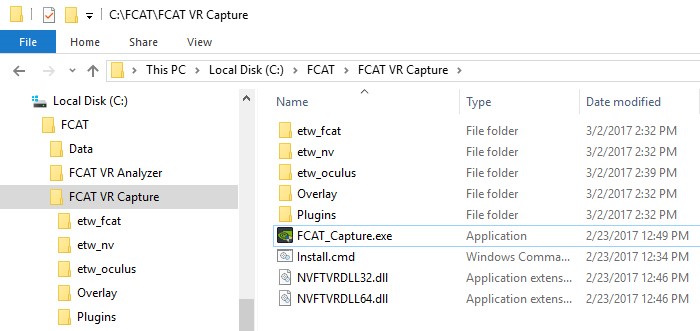
Unpack the downloaded file to the VR capture station where your HMD is installed. The software can run from anywhere.
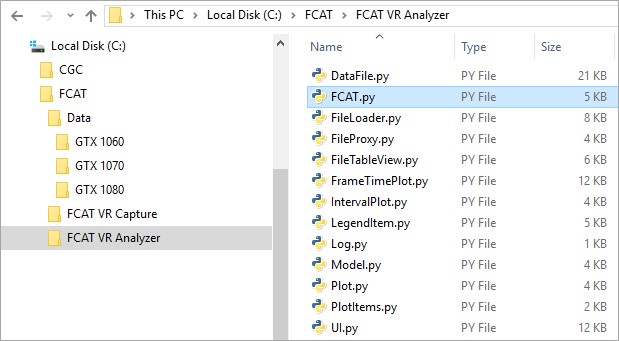
However, we recommend placing the files in a folder named FCAT VR Capture in C:FCAT as shown below.
Installation of FCAT VR Capture On HTC Vive
Please follow these instructions when using FCAT VR Capture with the HTC Vive.
- Ensure that all graphic drivers are properly installed.
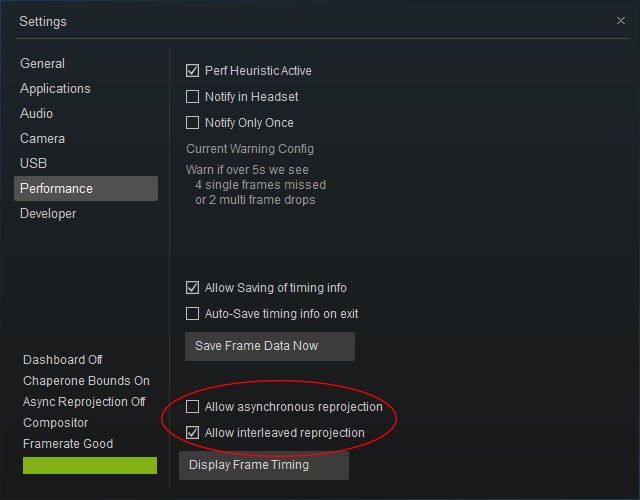
- Start SteamVR, click the File menu, and click Settings.
- Click Performance, and disable Allow asynchronous reprojection to ensure apples-to-apples testing with AMD competitive GPUs. Enable Allow interleaved reprojection.

NOTE: You must repeat steps 4 – 6 each time you install a new GPU or new graphics driver.
Installation of FCAT VR Capture On Oculus Rift
Please follow these instructions when using FCAT VR Capture with the Oculus Rift.
- Ensure that all graphic drivers are properly installed.
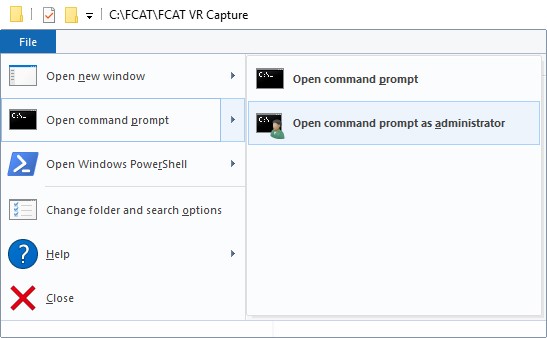
- Open a command window with administrator privileges in the directory of the supplied FCAT VR Capture files.

- From an administrator command line, execute Install.cmd.
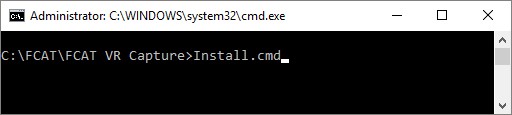
- Reboot your system
NOTE: You must repeat steps 2 – 4 each time you install a new GPU or new graphics driver.
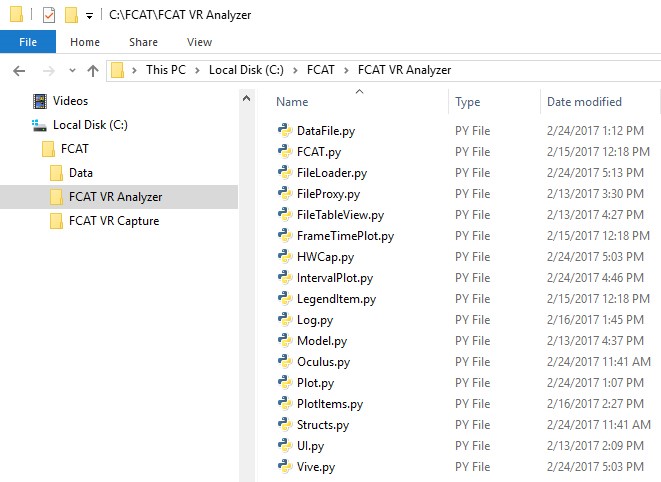
Unpack “FCAT VR Analyzer”
The FCAT VR Analyzer is also delivered in the same ZIP file. Unpack this file on the system you plan on using to analyze the captured VR data. This can be the same or a separate machine.
As before, we recommend creating an FCAT VR Analyzer folder in C:FCAT as shown below.
Installing Anaconda & pyqtgraph For FCAT VR Analyzer
FCAT VR is written with Python. As such, a few applications are needed.
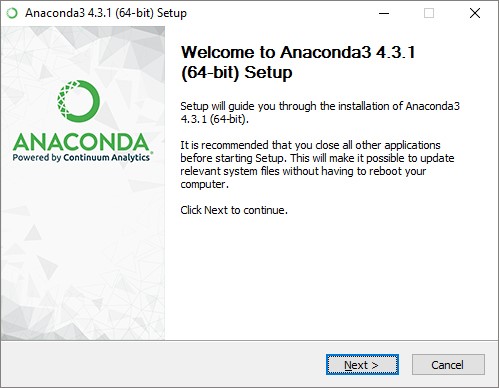
Anaconda
The first piece of independent software needed for FCAT VR to work is the Python software Anaconda. Download it here: https://www.continuum.io/downloads
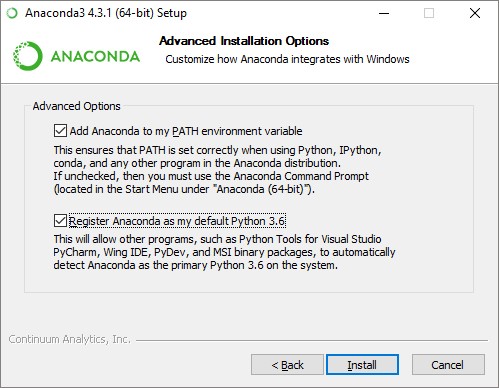
During installation, make sure to select Add Anaconda to the PATH environment variable and also select Register Anaconda as the default Python 3.6 (as shown below).
The second piece of independent software used by the scripts to generate charts and plots is called pyqtgraph.
To install pyqtgraph:
- After installing Anaconda, open a command window with administrator privileges from any location.

From an administrator command line, type the following:
python -m pip install pyqtgraph==0.10.0
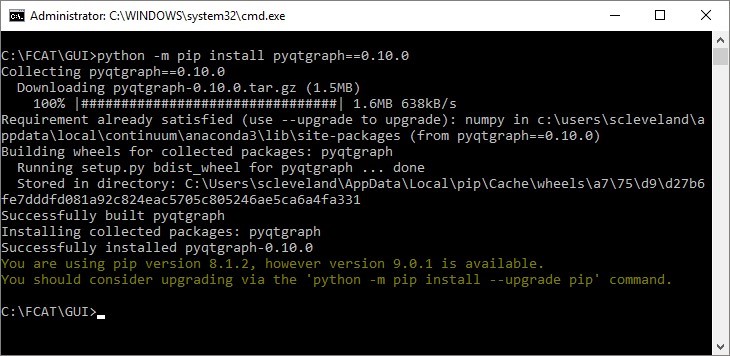
NOTE: You may need to reboot if Python does not work after installation.
How To Use FCAT VR Capture
FCAT VR Capture works with all versions of Windows, and all DirectX APIs, all GPUs, and both Oculus Rift and HTC Vive. However, there is no OpenGL support at this time.
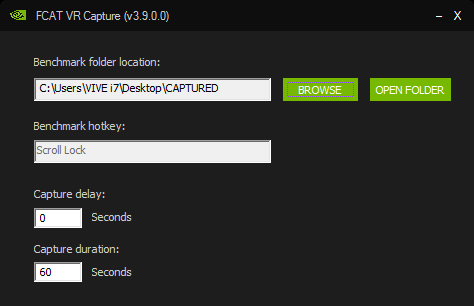
- Double-click FCAT_Capture.exe to launch FCAT VR Capture.
NOTE: Please ensure that FRAPS is shut down before launching FCAT VR Capture. As an additional step, it’s recommended to disable overlays from other applications to ensure they don’t step on FCAT VR Capture. - In Benchmark folder location, select the BROWSE button to select the preferred directory where benchmark results will be stored.
- Specify Capture delay and duration:
- Capture delay – Capture will start after ‘delay’ seconds. Setting this value to 0 starts the capture immediately.
- Capture duration – After ‘duration’ seconds are elapsed, the capture will stop automatically. Setting this value to 0 disables capture.
- Start a VR application. A red bar will appear along the right side of the HMD to indicate that FCAT VR Capture is currently running.
Indicator color legend: - Green = capture in progress
- Flashing green and red = delayed start
- Red = capture is stopped
- Press SCROLL LOCK to begin benchmarking. The red bar will turn green to indicate benchmarking is in progress.
NOTE: At this time, FCAT VR Capture only supports SCROLL LOCK as the benchmarking hotkey. At any point in time, if a capture is scheduled or running (indicator flashing or green), pressing SCROLL LOCK will stop the capture. To start the capture again, press SCROLL LOCK.
- Press SCROLL LOCK again to stop benchmarking.
- Exit the VR application and return to FCAT VR Capture. Click OPEN FOLDER to view benchmark results.
- Results generated by FCAT VR Capture will be saved as a directory with a timestamp name. Consider renaming the directory to reflect the GPU, game, and settings tested.
NOTE: We STRONGLY recommend using the directory structure outlined in the next section for your data.
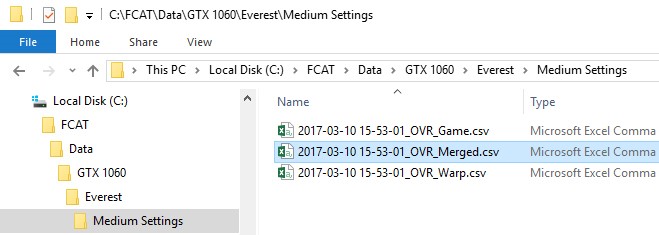
- Within the results directory, the file which includes the word “merged” in the filename needs to be used to generate data with the new FCAT VR Analyzer.
Sorting Captured Data
FCAT VR Capture creates three files. Always used the file with “Merged” in the name in the Analyzer.
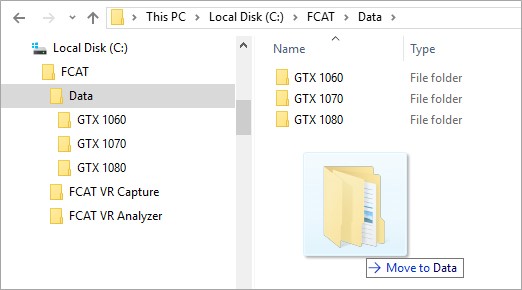
It is recommended that the data captured using FCAT VR Capture are placed in directory structure shown below.
Use the C:FCAT directory as your base directory, and then create a Data folder to place your captured VR data into.
Use the folder naming method for your captured VR data as follows:
C:FCATDATA<GPU><GAME><SETTINGS><OTHER>
NOTE: The folders used for <OTHER> in this example are for LMS and MRS captures.
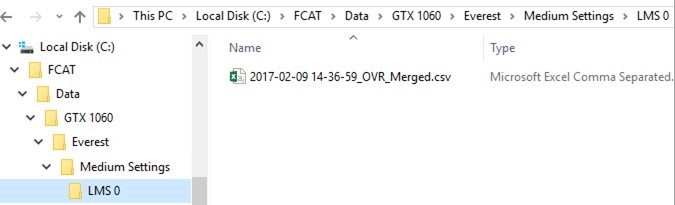
This is the folder structure using the example above:
C:FCATDATAGTX 1060EverestMedium SettingsLMS 0
NOTE: You can use dashes, underlines, or spaces in the folder names.
Using this folder structure will more easily allow the FCAT VR Analyzer software to capture the GPU, Game, Settings, and other info that you would like included in your charts.
Using the folder structure above will make it easier for the FCAT VR Analyzer to properly fill in the elements based on your folder structure.
How To Analyze Captured FCAT VR Data
Smoothness is important for VR gaming, and users can evaluate stutter that might affect game fluidity in a few different ways. The most important method is simply to experience VR and evaluate how it feels. Does it hitch? Is there stutter? Pan the view around and feel how smooth it is in motion.
FCAT VR works on FRAPS and the new FCAT VR Capture frame time data. This section describes how to use FCAT VR.
Running FCAT VR Analyzer
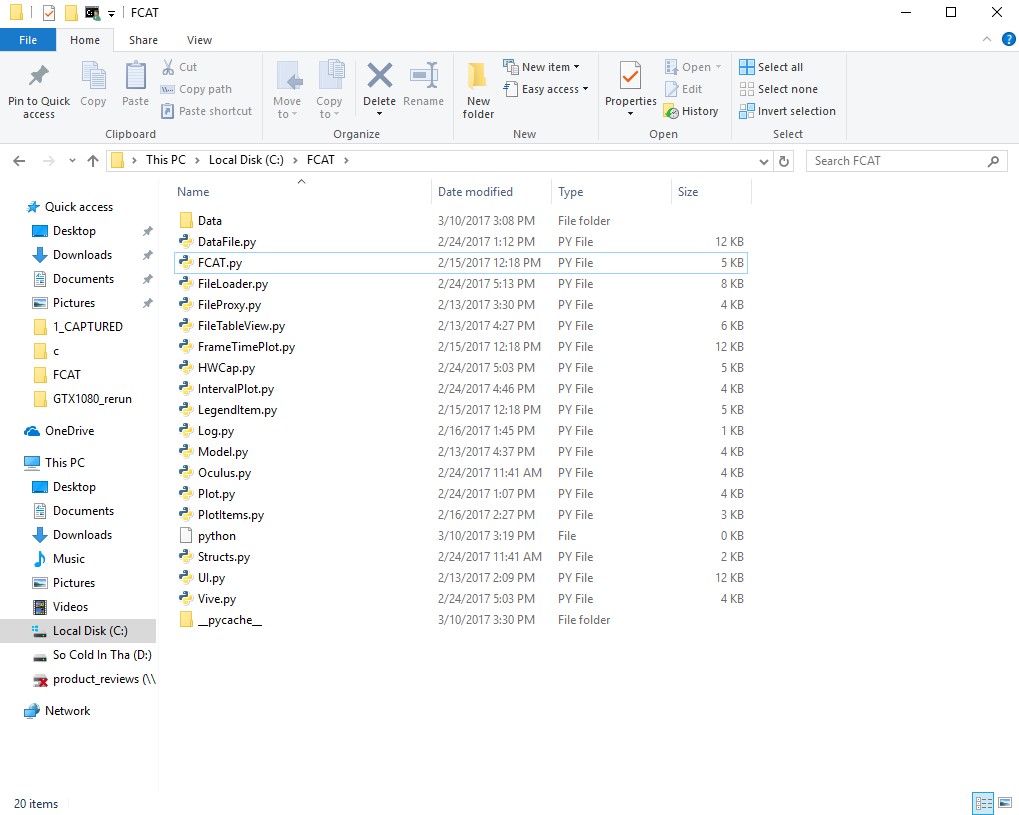
After installing the software above, you should be able to run the FCAT VR Analyzer by double-clicking (opening) FCAT.py as shown below.
If FCAT.py is not associated properly with Python, you will need to set up the associate manually. Follow these instructions for doing this:
- Right-click on FCAT.py in Windows File Explorer and select Open with…
- Select Always use this app to open .py files and then click More apps.
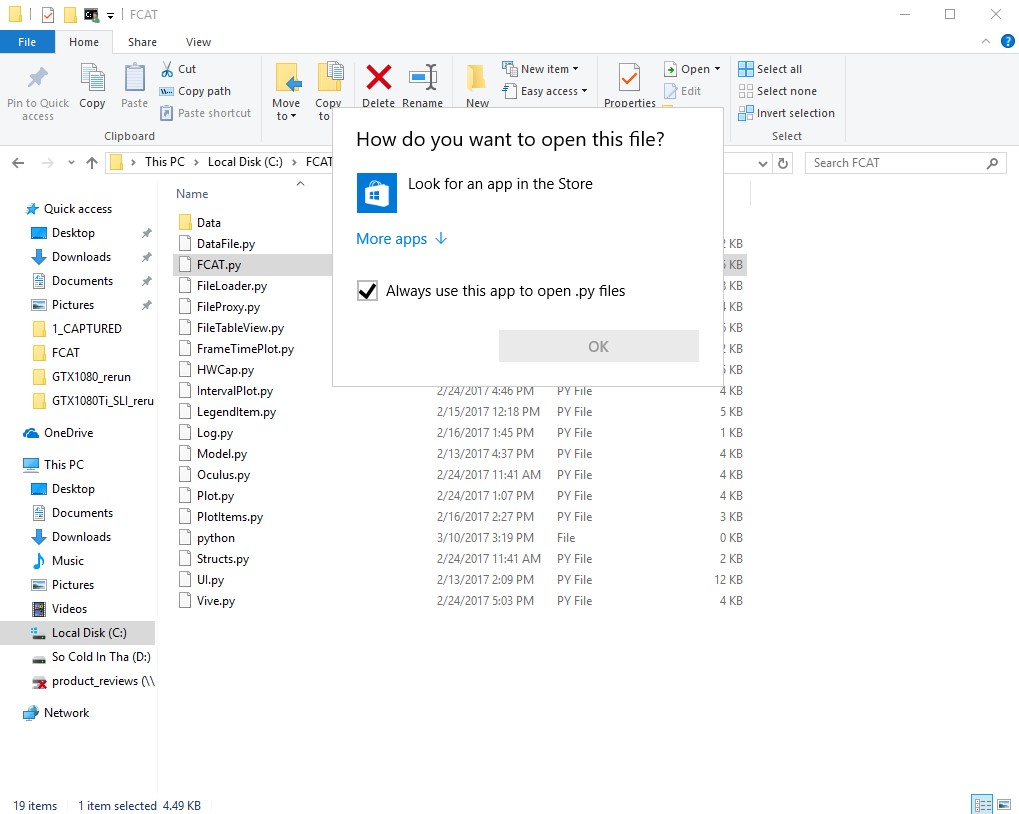
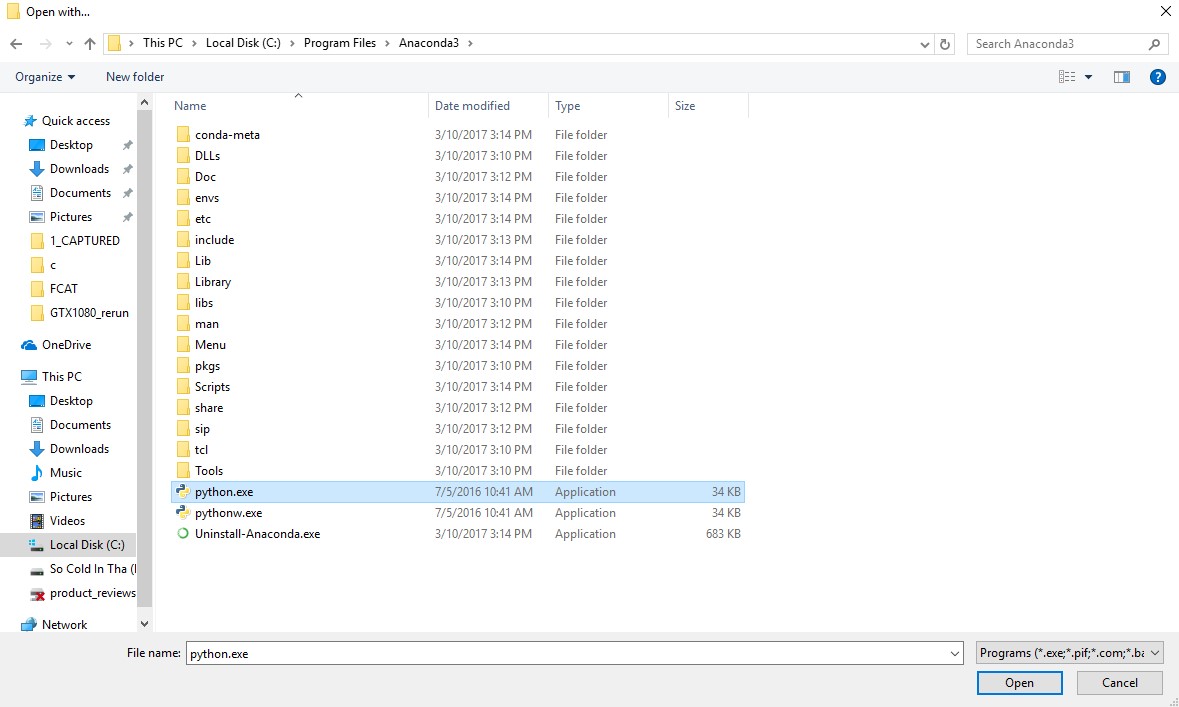
- A bunch of applications will be shown. Click on Look for another app on this PC.
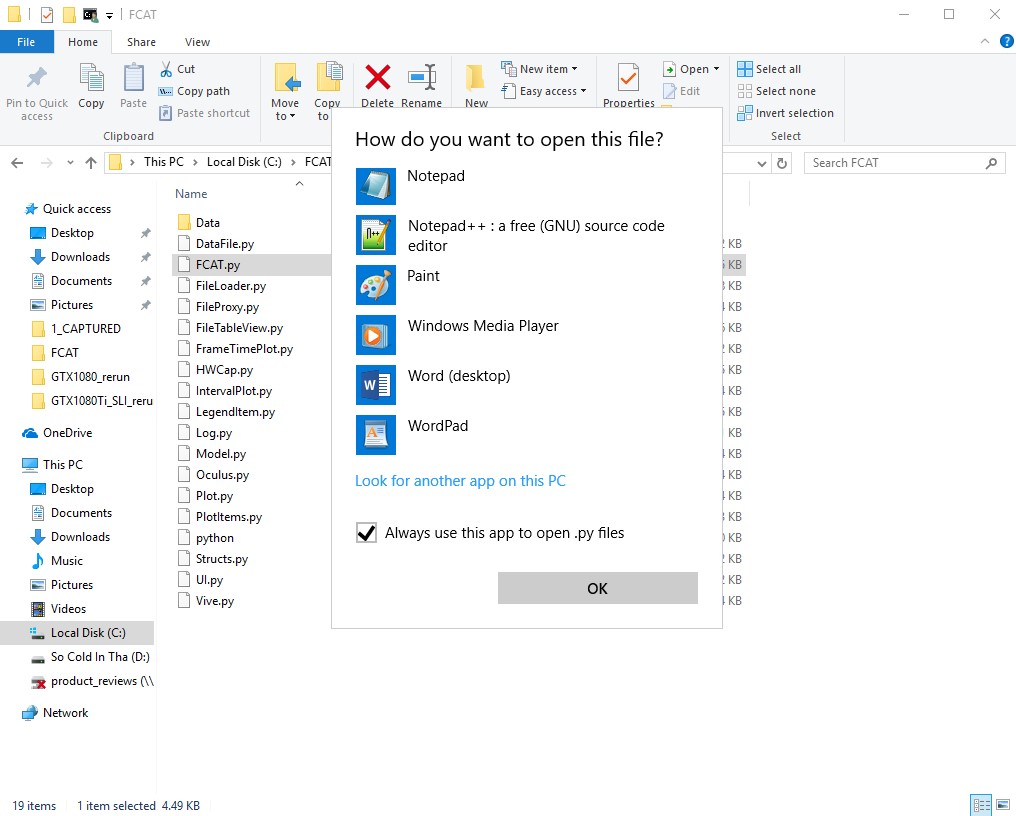
- You will now need to browse to the location of Python.exe in the Anaconda3 folder.
- Select Python.exe and click the Open button.
- FCAT.py should now be associated to Python.exe. All of the .py files will now have the Anaconda icon associated with them (as shown below).
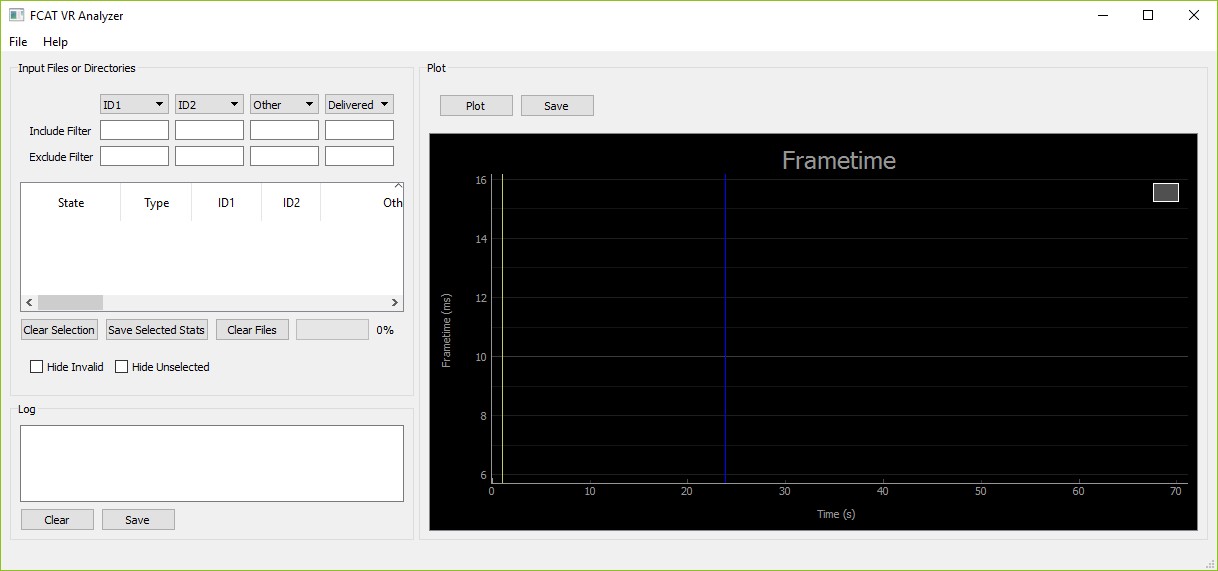
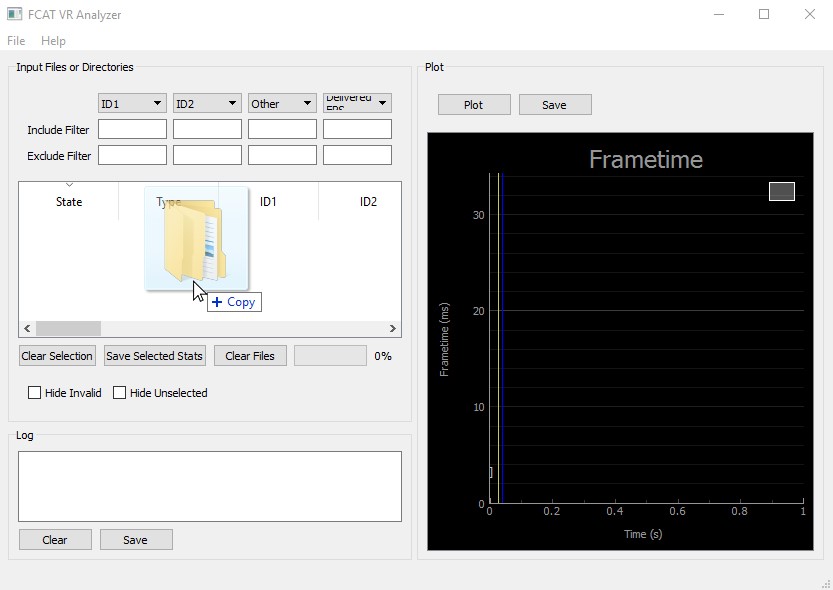
Once launched, FCAT VR Analyzer looks like this:
To get data in, select the data folder from Windows Explorer and drag it with the mouse into the FCAT Analyzer program. Always drag from the data folder. This is the folder that contains the subfolders as outlined above. You can see in the example below:
C:FCATDATA<GPU><GAME><SETTINGS><OTHER>
NOTE: You can drag multiple GPU folders into FCAT VR Analyzer. In fact, there is no limit.
Drag the folder(s) into the top-left region as shown below:
Your data should look like this:
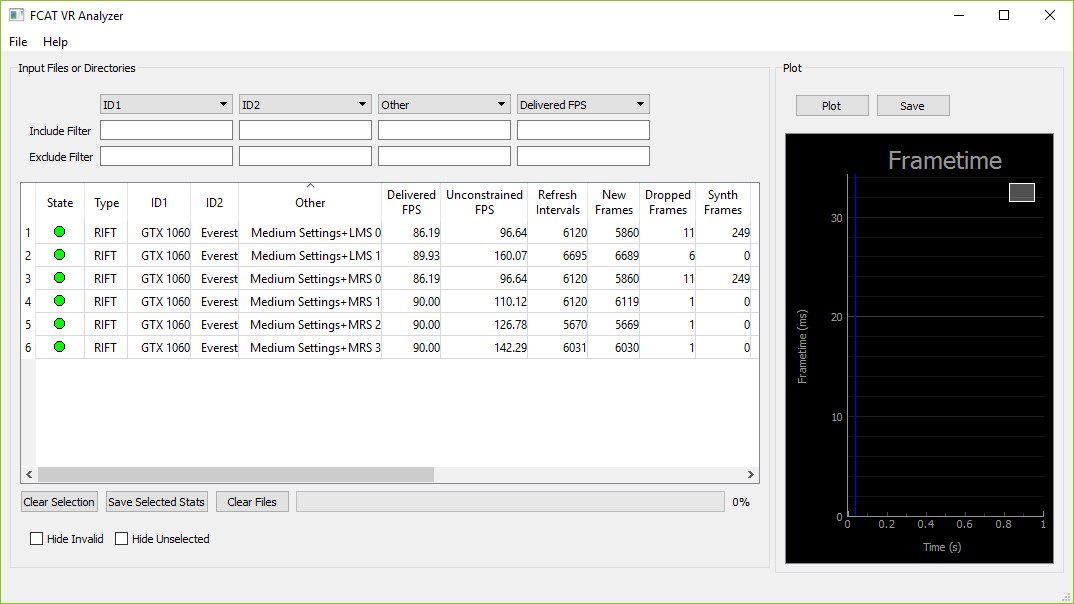
The FCAT VR Analyzer application contains three regions, and each of these regions can be resized by using the mouse as needed.
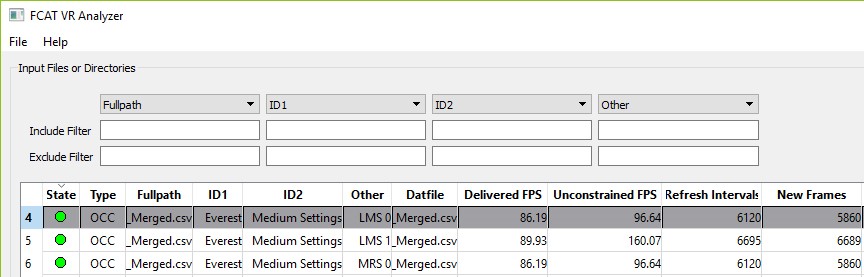
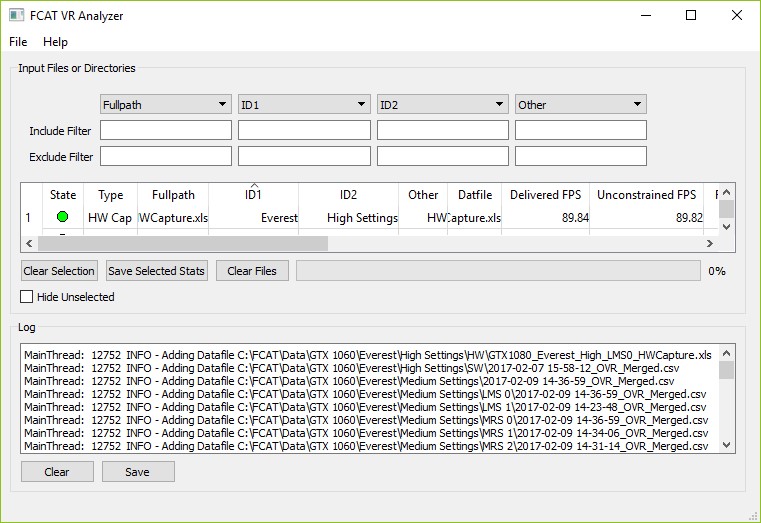
Input Files or Directories Region
The main section allows for the organization and manipulation of captured VR data. This is where you can filter, sort, and rename data.
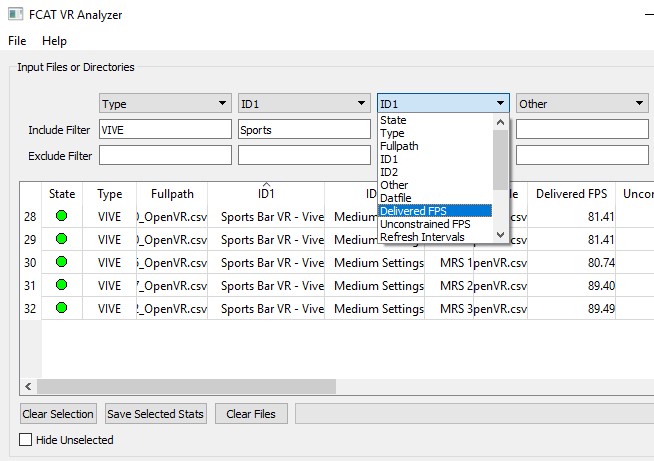
FiltersUsing filters is a great method to sort through vast amounts of captured data. There are filters to include and exclude data from any of the data columns. The drop-down menus allow for up to four columns of data to be filtered. These column headers can be changed by selecting the drop down menu and selecting another column header to be filtered (as shown below).
Click on a data row to select it, and click it again to deselect it. Multiple rows can be selected by clicking and dragging the mouse down over the data, and all data can be selected by pressing Ctrl+A.
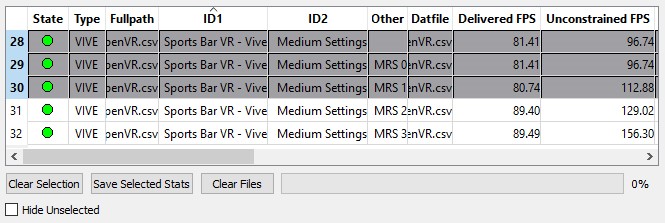
Clicking Clear Selection will clear any of the data that has already been selected, and clicking Clear Files will remove all data from the data window. Clicking Hide Unselected will hide data that is currently not selected.
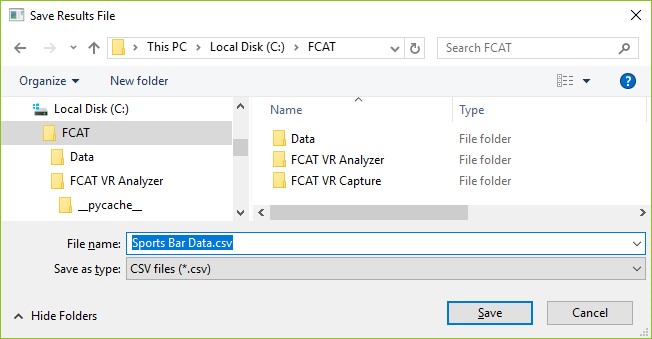
Save Selected StatsClicking Save Selected Stats will open a window where the selected data can be saved as a .CSV file (see below).
Log Region
The logging window provides information in case of error. This data can be saved and sent to NVIDIA to assist with troubleshooting.
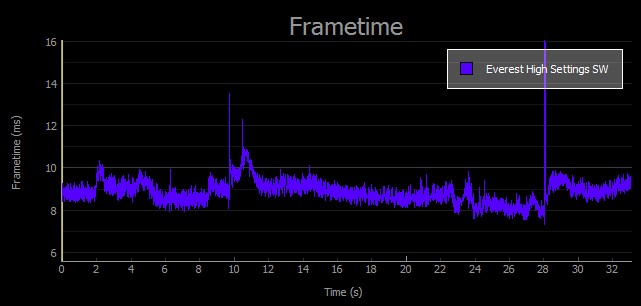
Clicking the Plot button will create charts for all of the data that has been selected. Clicking the Save button will allow the plot to be saved to a .PNG file.
NOTE: Up to eight datasets are currently supported.
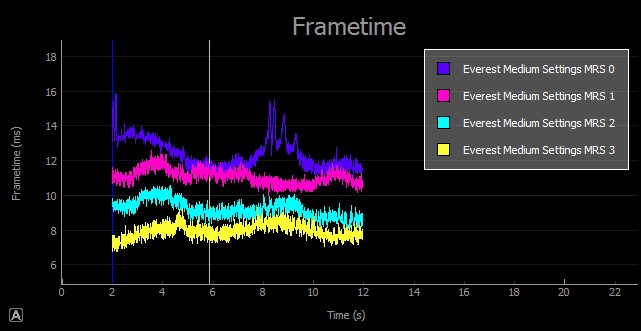
Making and Manipulating Charts
Using the Mouse
The plot lines can be easily moved around using the mouse. This allows the chart to be centered and zoomed as required.
Use the middle mouse wheel to zoom in and out:
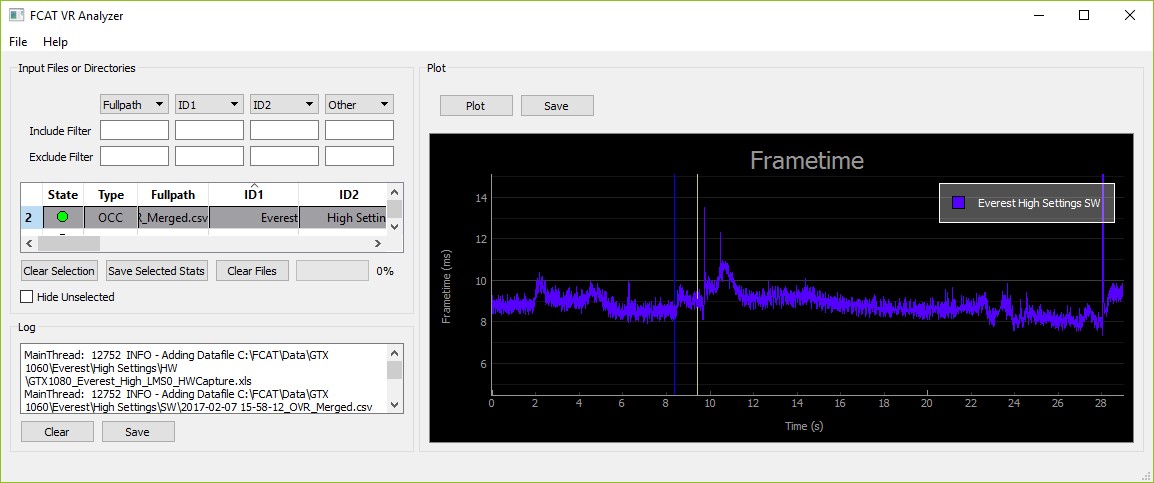
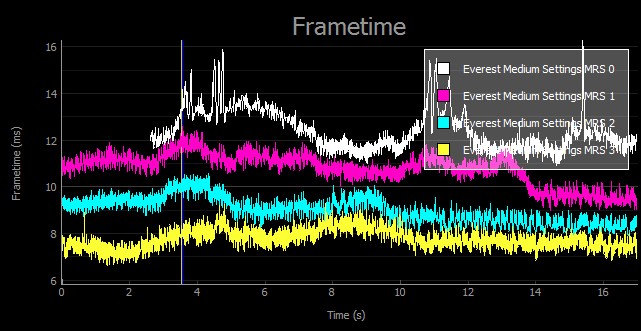
Selecting a line will turn it white to show that it has been selected:
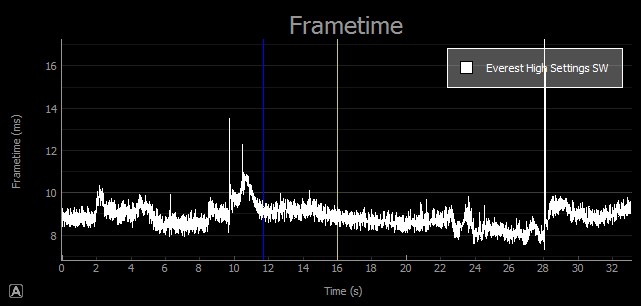
NOTE: The blue vertical line is where the chart line was selected using the mouse, and the yellow vertical line will continuously follow the mouse as it’s moved around the plot.
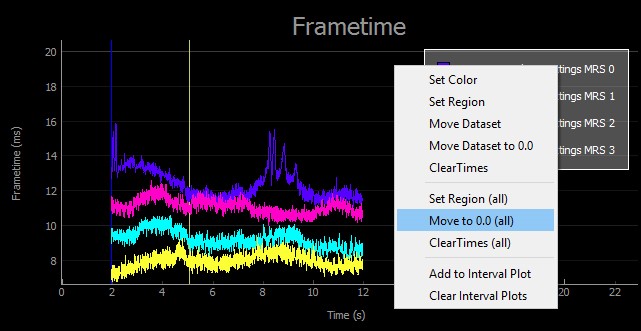
Right-clicking on the plot will expose the Plot Menu. This will allow you to manipulate the plot lines that you have selected.
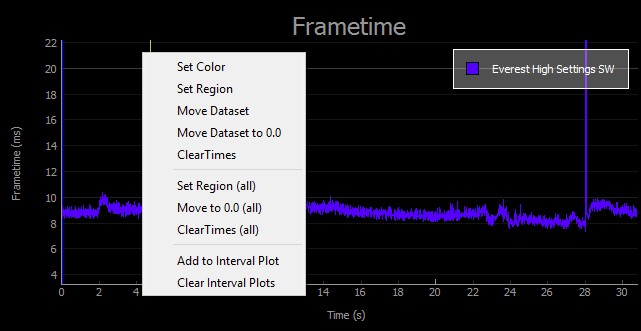
Chart line colors can be changed using this option. First, select the chart line by clicking on it (which turns it white), and then right-click on the plot and select Set Color.
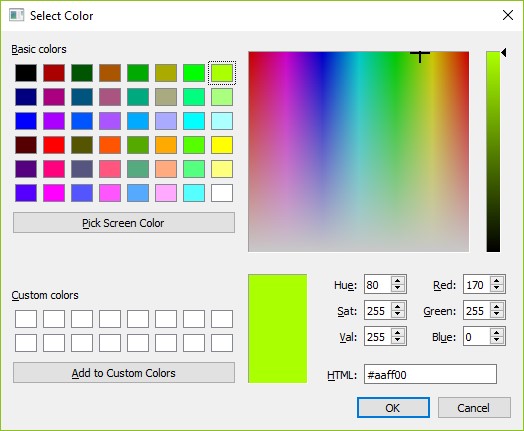
In this example, we selected green as our new line color.
Use this option to trim the beginning and ends of the chart line. This is useful when you have data outside the benchmark area such as menus. This extra data not only looks wrong on the chart, but it can negatively affect the FPS data as well (and other data including a number of dropped and synthetic frames).
Use the blue and yellow lines to set the region, which allows for trimming of the start and end data from the chart. First, select the starting point by selecting the chart line (left-click) where you want the beginning data trimmed, then select the end point with a right-click.
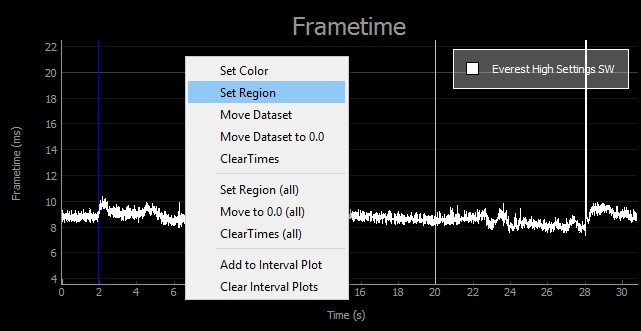
Select Set Region when the desired area is selected to trim your data.
NOTE: The FPS and other data will be affected by the new region that you set.
This allows multiple chart lines to be trimmed together.
We decided to set the region between 2 seconds and 12 seconds.
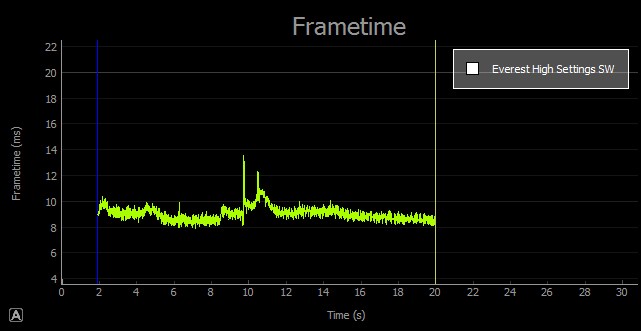
This setting allows all line charts to be realigned to the 0 second starting time on the chart. Once these regions have been set using the blue and yellow vertical lines, right-click on the plot and select Move to 0.0 (all).
Once complete, all of the lines should begin at the 0 second point on the X-axis.
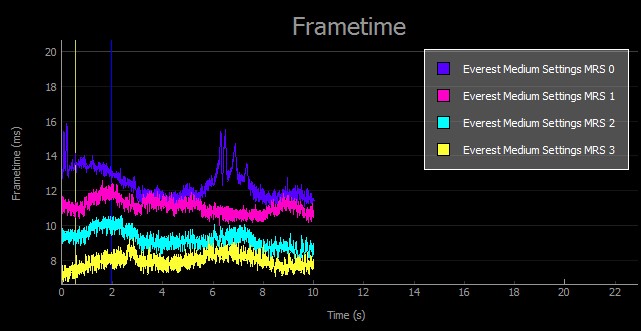
Notice how the chart lines used in the example above are not properly aligned? It would have been better to move the lines first and then trim them by setting the region.
To undo the trim, select the chart line, right-click, and then select Clear Times.
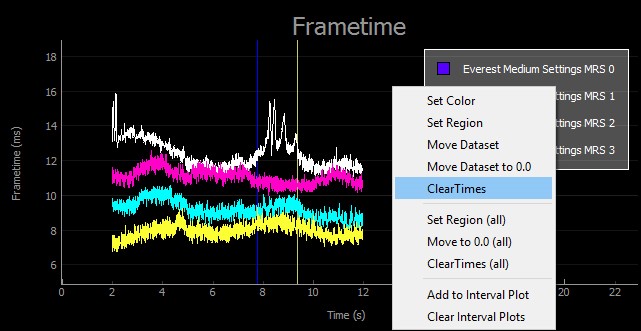
NOTE: You will need to do this individually for each chart line.
This works like Clear Times, but affects all chart lines in the plot.
Move DatasetTo move a chart line, select the new area you would like to move it using the left-mouse button. This will place a blue vertical line. Then click on the chart using the right-mouse button to drop the yellow vertical line where you want the chart to be moved.
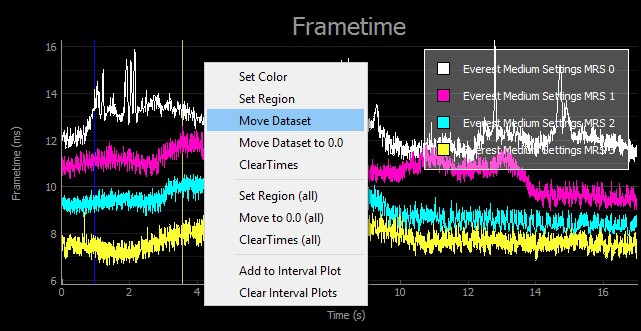
After clicking Move Dataset, the chart line will move to the area. If you accidentally moved it to the wrong spot, then simply select the line, right-click on the plot, and select Clear Times to reset the chart line.
This will realign all chart lines in the plot back to 0 seconds on the X-axis.
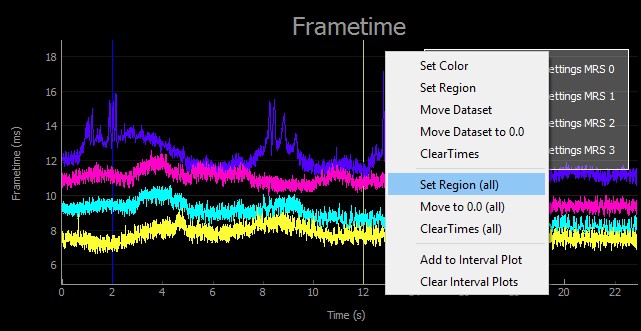
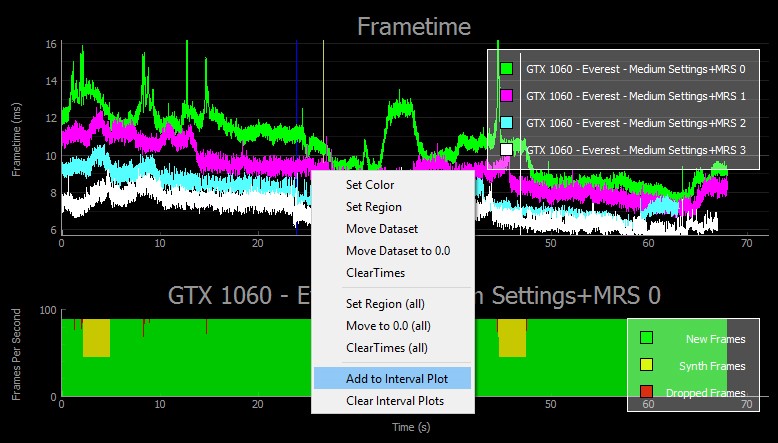
Add to Interval PlotThe Interval Plot shows data for new frames, synthetic frames, and dropped frames. To create an Interval Plot, select a chart line, right-click on the plot, and then select Add to Interval Plot.
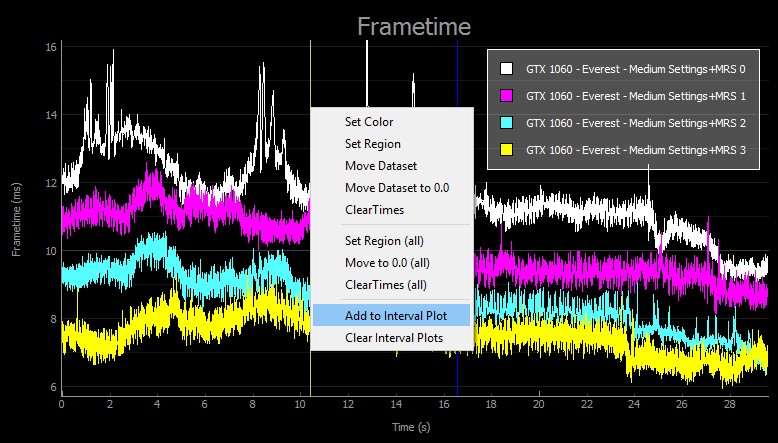
An Interval Plot makes it easy to see the synthetic and dropped frames that occurred in the VR application during SW capture. You can easily compare the chart line to the Interval Plot to see where the synthetic frames occurred in the VR capture below. Everest with MRS 0 shows synthetic frames between 2.5 and 6 seconds where the chart line strays above 11.1 ms.
To add another Interval Plot, simply select another chart line, right-click in the plot area, and select Add to Interval Plot.
This time we selected the MRS 3 chart line which shows that no synthetic or dropped frames occurred when using MRS 3 in VR with Everest using Medium Settings.
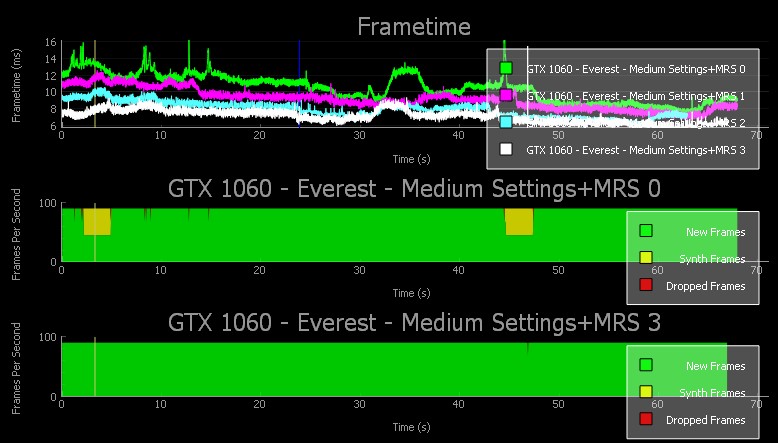
By following these steps you are now able to show an all-in-one overview of performance, frametimes, reprojection and dropped frames, instantly conveying the quality of the VR gaming experience on a GPU in any compatible game. And by combining several charts performance with different settings can be directly compared, further improving the presentation of results.
Recommended Games For First-Time VR FCAT Benchmarking
Our technical marketing team has worked closely with media outlets, hardware manufacturers and game developers to determine games and benchmark scenarios that are easy to get consistent results from and are easily accessible, helping you test the waters of FCAT VR benchmarking. Below, you can view these recommendations.
| GAME |
VR HMD |
BENCHMARK AREA |
| Everest VR |
HTC Vive & Oculus RIft |
Khumbu Icefall: Start at the front of the ladder, walk across the ladder, turn to the left and climb the other ladder; stop recording when you reach the top. |
| NVIDIA VR Funhouse |
HTC Vive |
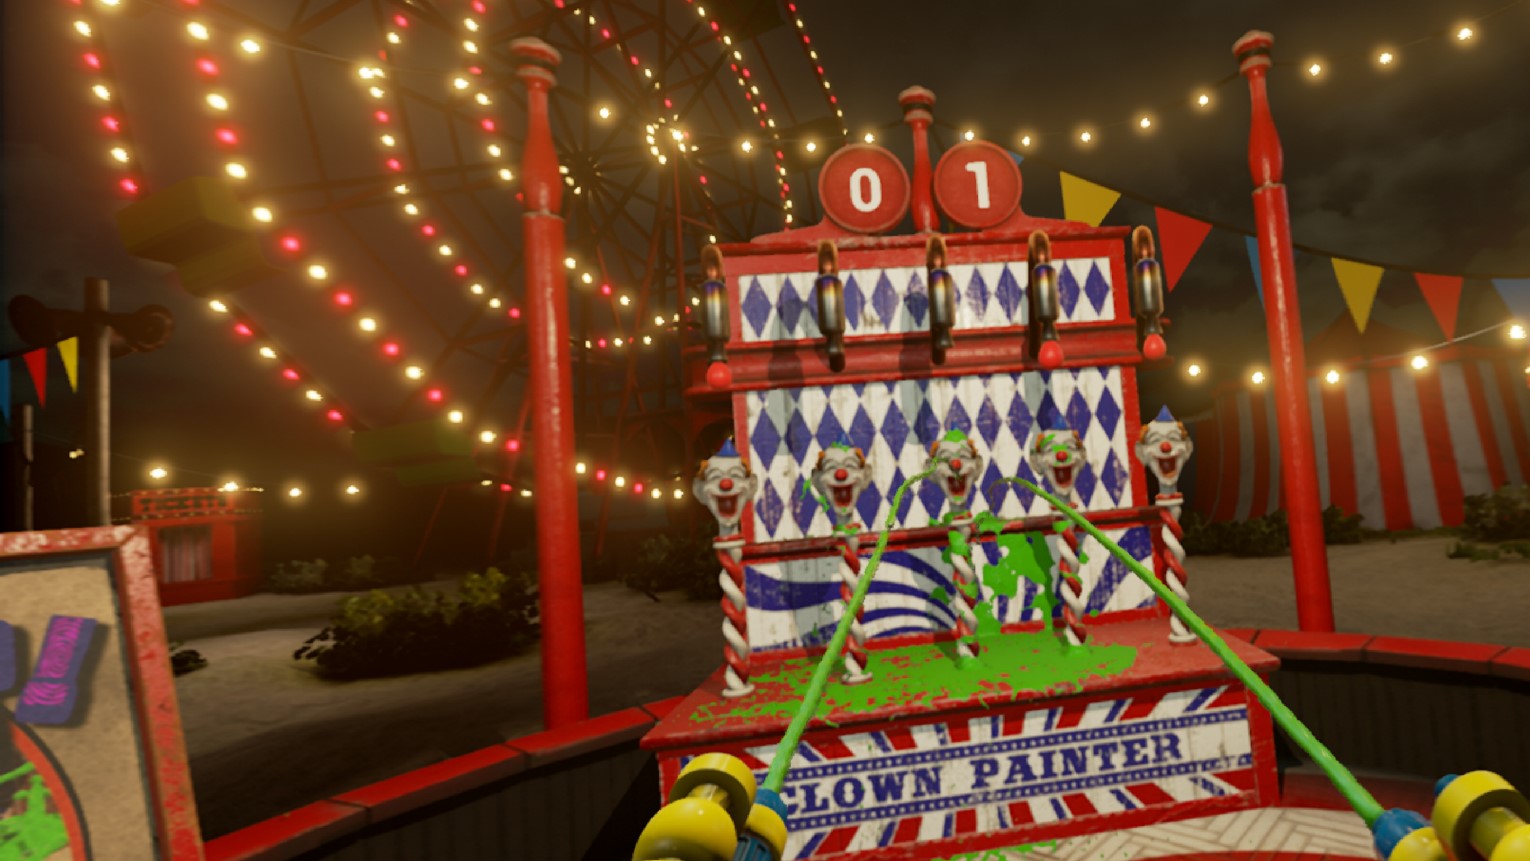
Load the Clown Painter mini-game, slecet the desired MRS level using the numpad keys, benchmark 30-60 seconds filling the balloons with goo. *Clown Painter uses a FleX particle based fluid simulation along side an ellipsoid splatting fluid surface rendering technique. |
| Raw Data |
HTC Vive |
Bishop character, 1st level (Hard Point), insert the key into the slot. Begin benchmarking when the robot breaks the glass. Shoot robots and stop benchmarking after the first wave is defeated. |
| Robo Recall |
Oculus Rift |
Play through the intro, you will be placed back into the office area. From the office, select Zone 1 (City Center) Mission 1-1 (Batch Recall). Set Time of Day to “DAY”. Play through the first 3 waves of enemies (3 warps), until 60 seconds has expired. |
| Serious Sam VR: The Last Hope |
HTC Vive |
Play through the first wave of enemies on the Earth level at the easiest difficulty. |
| Sports Bar VR |
Oculus Rift |
8-ball Free play for ~60 seconds. Use Ctrl+0,1,2,3 to change MRS levels. |
| SUPERHOT |
Oculus Rift |
Start the game and get to the balcony within 30 seconds. |
| The Unspoken |
Oculus Rift |
Practice, Elmhurst Ave, Targets. Throw 3 fireballs at targets. Use 2 special attacks (Push and Fireworks). Continue throwing fireballs for about 45 seconds. |
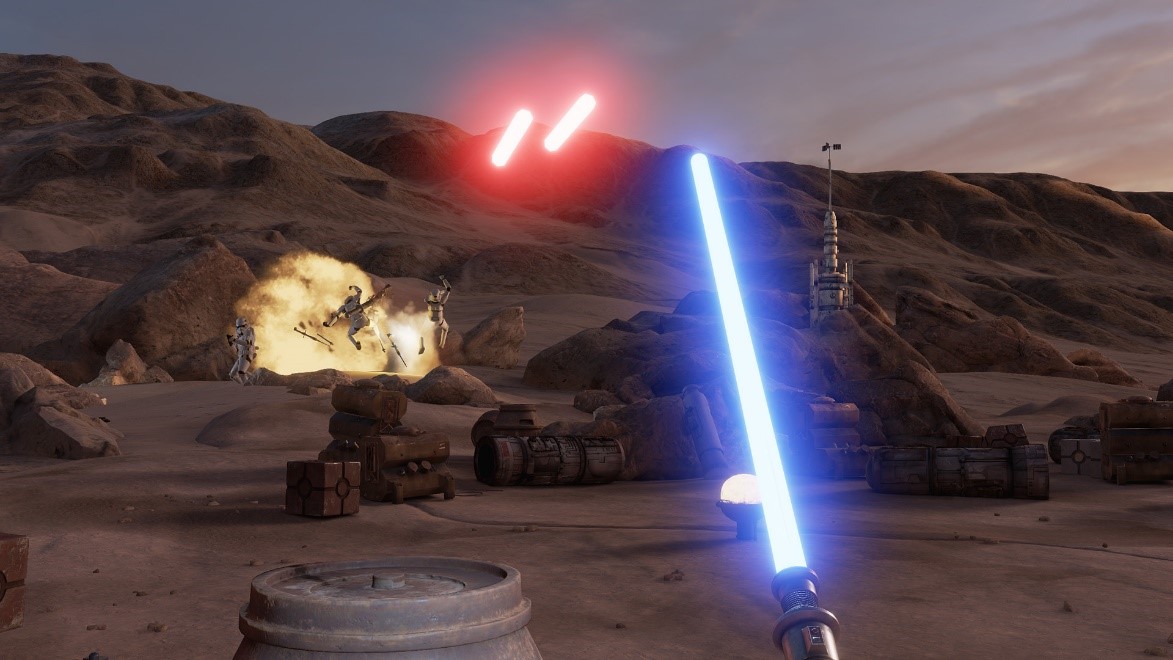
| Trials on Tatooine |
HTC Vive |
Begin recording when you pick up the lightsaber, end recording when the imperial ship takes off. |
Several of these games also include NVIDIA VRWorks enhancements, improving performance and image quality. With FCAT VR, the benefit of these technologies can be properly measured and shown for the first time.
NVIDIA VRWorks Overview
NVIDIA VRWorks software is a comprehensive suite of APIs, sample code, and libraries for VR developers. Whether developing a groundbreaking VR application or designing the next generation of Head Mounted Displays, NVIDIA VRWorks helps developers achieve the highest performance, lowest latency, and plug-and-play compatibility. VRWorks includes the following features:
NVIDIA VRWorks for Headset developers
|
|
With Direct Mode, the NVIDIA driver treats VR headsets as head mounted displays accessible only to VR applications, rather than a normal Windows monitor that your desktop shows up on, providing better plug and play support and compatibility for the VR headset. |

|
|
Context Priority provides headset developers with control over GPU scheduling to support advanced virtual reality features such as asynchronous timewarp, which cuts latency and quickly adjusts images as gamers move their heads, without the need to re-render a new frame. |

|
|
Front buffer rendering reduces latency by rendering directly to the front buffer. |
NVIDIA VRWorks for Application Developers
|
|
Multi-Res Shading is an innovative new rendering technique for VR whereby each part of an image is rendered at a resolution that better matches the pixel density of the warped image. Multi-Res Shading uses Maxwell’s multi-projection architecture to render multiple scaled viewports in a single pass, delivering substantial performance improvements. |
|
|
Lens Matched Shading uses the new Simultaneous Multi-Projection architecture of NVIDIA Pascal™-based GPUs to provide substantial performance improvements in pixel shading. The feature improves upon Multi-res Shading by rendering to a surface that more closely approximates the lens corrected image that is output to the headset display. This avoids rendering many pixels that would otherwise be discarded before the image is output to the VR headset. |
|
|
Traditionally, VR applications have to draw geometry twice -- once for the left eye, and once for the right eye. Single Pass Stereo uses the new Simultaneous Multi-Projection architecture of NVIDIA Pascal-based GPUs to draw geometry only once, then simultaneously project both right-eye and left-eye views of the geometry. This allows developers to effectively double the geometric complexity of VR applications, increasing the richness and detail of their virtual world. |

|
|
VR SLI provides increased performance for virtual reality apps where multiple GPUs can be assigned a specific eye to dramatically accelerate stereo rendering. With the GPU affinity API, VR SLI allows scaling for systems with two or more GPUs. VR SLI is supported for DirectX and OpenGL. |
In addition, NVIDIA VRWorks includes components that cater to professional VR environments like Cave Automatic Virtual Environments (CAVEs), immersive displays, and cluster solutions.
We will go into more detail about Multi-res Shading and VR SLI later. To learn more about other NVIDIA VRWorks, visit https://developer.nvidia.com/vrworks.
Multi-Res Shading (MRS)
 Multi-Res Shading is a rendering technique that helps reduce rendering cost without impacting perceived image quality. The screen is divided into multiple viewports, and by using the Maxwell and Pascal GPU hardware-based multi-projection feature, the entire scene geometry can be broadcasted to each viewport, and geometry that does not touch particular viewports is culled (thrown away) quickly. The outer viewport images are rendered at lower resolution, while the center viewport is rendered at full resolution. Overall performance is improved while not reducing perceived image quality.
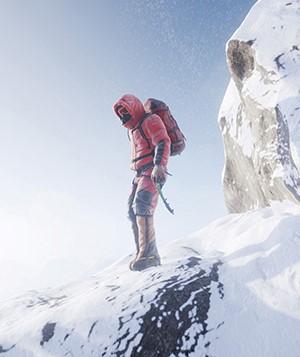
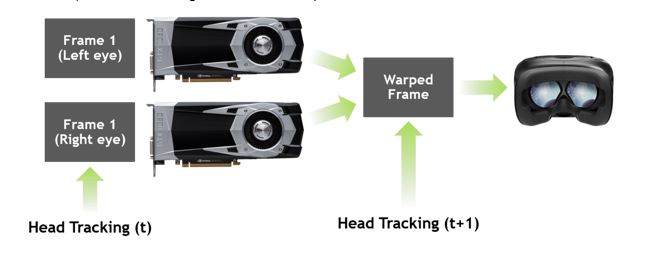
The image presented on a virtual reality headset has to be warped to counteract the optical effects of the lenses.
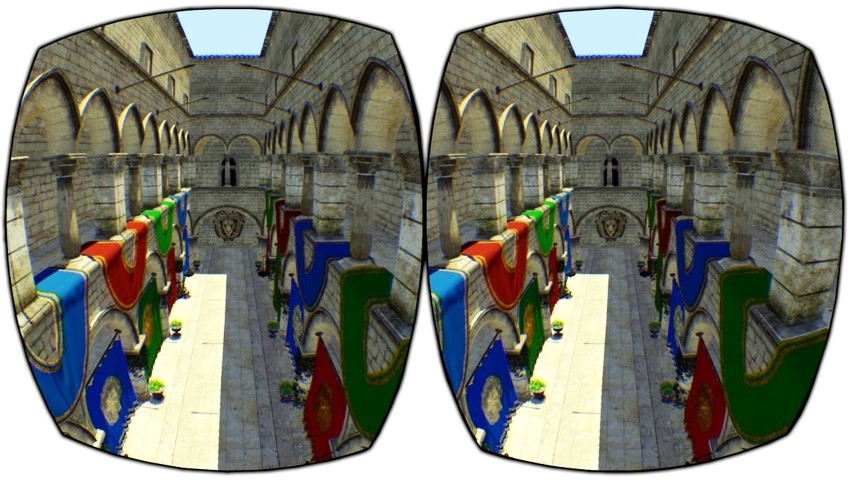
Instead of being square, the images look curved and distorted, but when viewed through appropriate lenses, the image appears accurate.
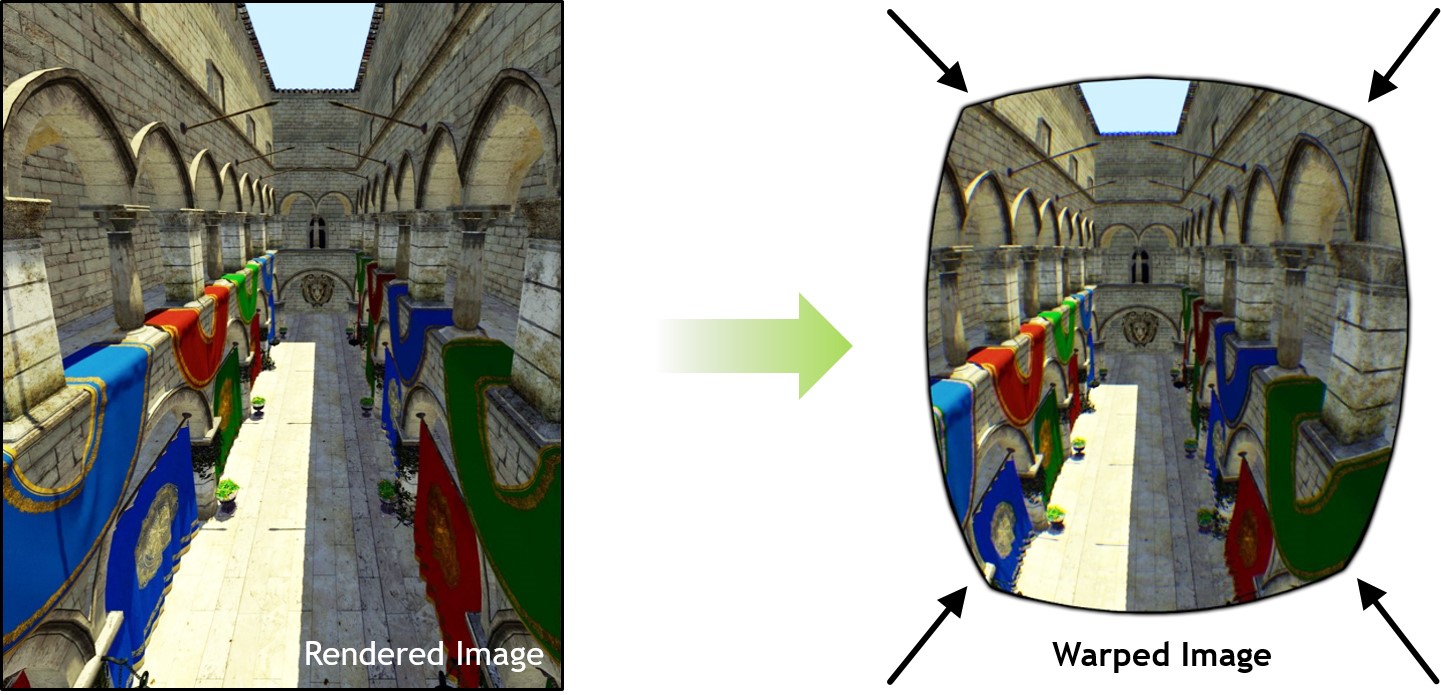
GPUs do not natively render into this sort of distorted view. Rather, current VR platforms use a two-step process that first renders a normal image (left), then second does a post-processing pass that resamples and prewarps the image to the distorted view (right). While this solution works, it is inefficient because there is oversampling at the edges.
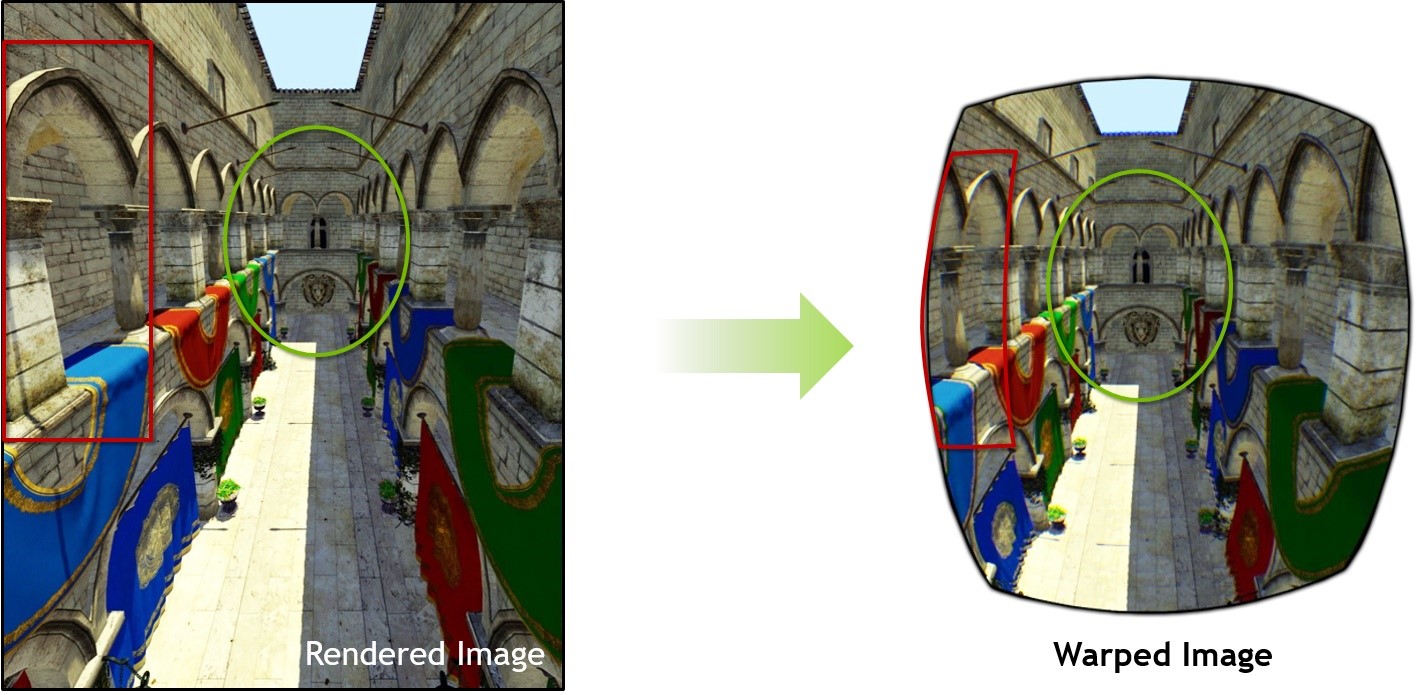
In the image above, the center (green) is nearly unaffected, but the sides (red) are squished. The result is that many of the rendered pixels along the edges are discarded when creating the final, warped image. Generating pixels that will just get discarded later is inefficient and wasted work.
Subdividing and ScalingNVIDIA Multi-Res Shading works by subdividing the image into separate viewports. As described above, the Maxwell and Pascal multi-projection hardware feature is able to send scene geometry to each viewport without extra processing except for culling geometry not hitting those viewport areas.
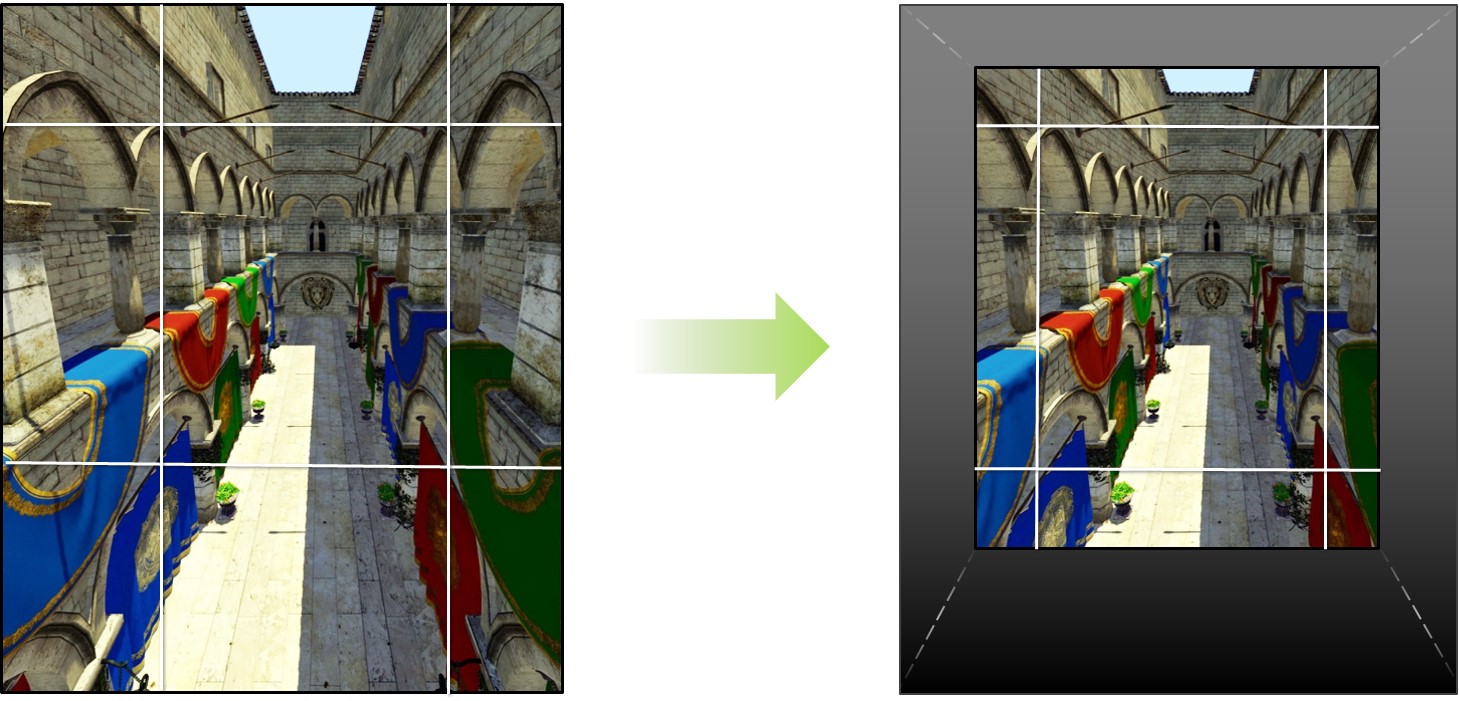
Each viewport is then warped, and the maximum sampling resolution needed within that portion of the image is closer to the final displayed pixels. The center viewport is also warped and stays nearly the same. This better approximates the warped image, but without over shading. And because fewer pixels are shaded, the rendering is faster. Depending on the settings for the Multi-Res Shading, savings can be anywhere from 25% to 50% of the pixels. This translates into a 1.3x to 2x pixel shading speedup.
Multi-res Shading is now integrated into Epic’s UE4. UE4-based VR applications such as Everest VR by Sólfar Studios and Thunderbird: the Legend Begins by InnerVision Games have also integrated this technology with many more apps to come.
Multi-Res Shading integrations for Unity and Max Play engines are currently in progress. These engine integrations will make it easy for more VR developers to integrate the technologies into their apps.
Smart SupersamplingIn some situations MRS Level 1 (MRS 1) will increase quality by supersampling the the center viewport. The quality increase may cause a decrease in performance. In the current Unreal Engine 4 branch, MRS Level 1 is defined relative to the lens parameters that will give this visual quality increase without the large performance degradation due to typical sumpersampling methods.
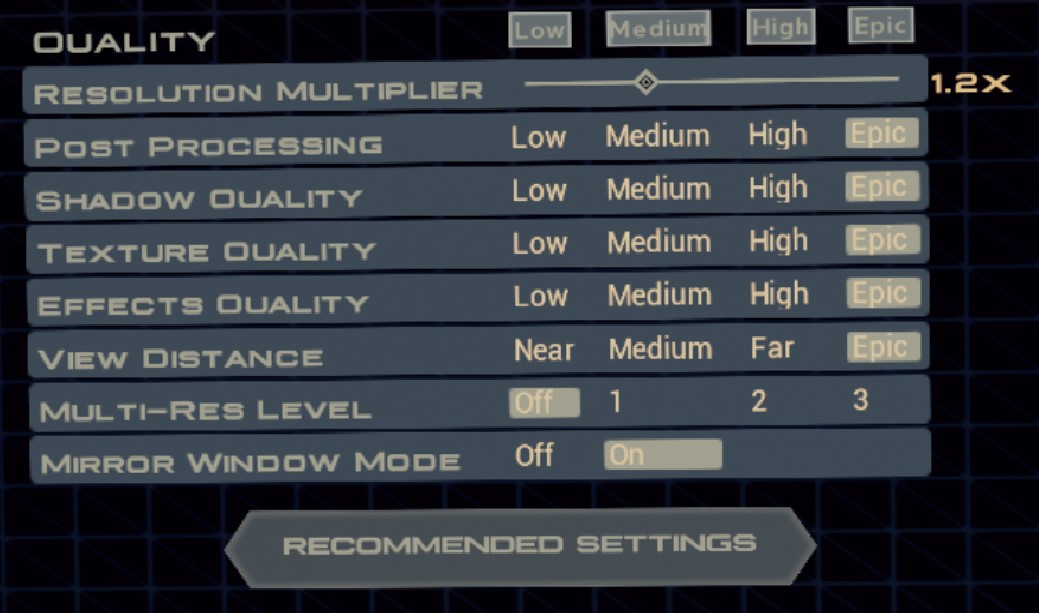
Benefits of MRSQuality settings can be increased since MRS reduces the rendering cost of VR games. For example, the graphics quality preset in Raw Data can be increased from Low to Medium with a GeForce GTX 1060 when Multi-Res Level 2 is used.
| Setting | Without VRWorks | With VRWorks |
| Preset | Low | Medium |
| Resolution Multiplier | 1.0x | 1.1x |
| Post Processing | Low | Medium |
| Shadow Quality | Low | Medium |
| Texture Quality | Low | Medium |
| Effect Quality | Low | Medium |
| View Distance | Near | Medium |
| Multi-Res Level | Off | 2 |
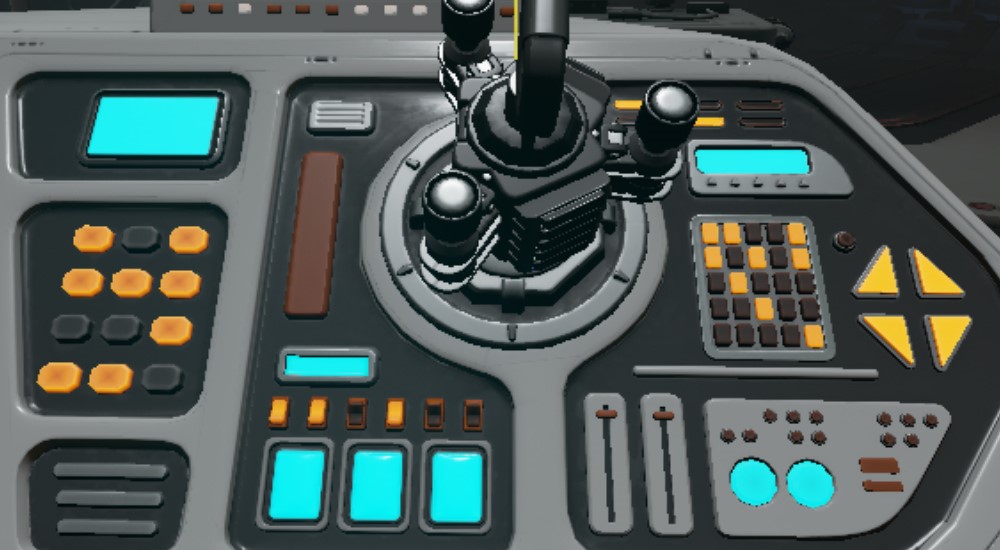
With VRWorks disabled, lower quality settings must be used, which does not include anti-aliasing or shadows.
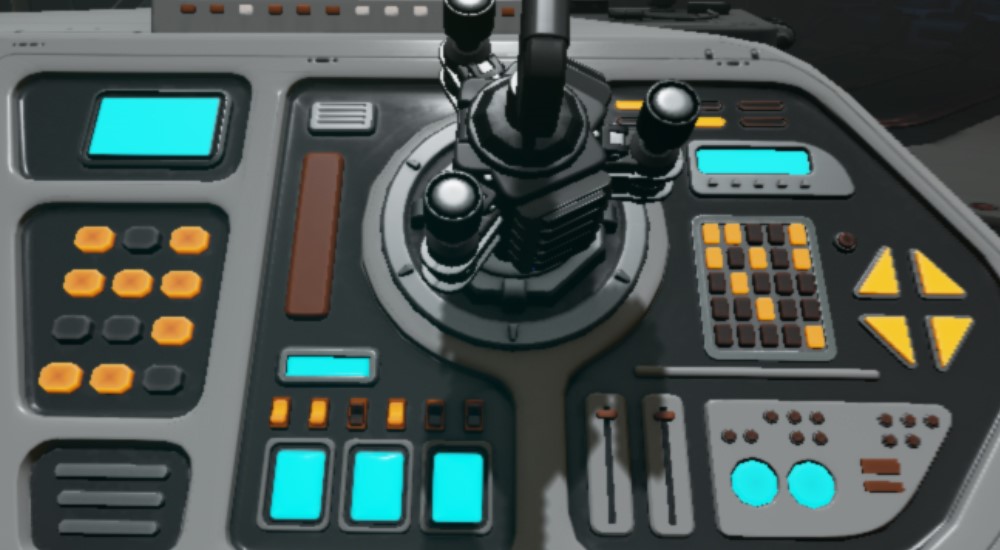
VRWorks with MRS allows for higher-quality settings. The Medium Preset with higher quality shadows makes the control panel look more realistic and polished.
Lens Matched Shading (LMS)
The explosive growth of interest in VR applications has increased the importance of supporting displays which require rendering to non-planar projections. VR displays have a lens in between the viewer and the display, which bends and distorts the image. For the image to look correct to the user, it would have to be rendered with a special projection that inverts the distortion of the lens. Then when the image is viewed through the lens, it will look undistorted, because the two distortions cancel out.
Traditional GPUs do not support this type of projection; instead they only support a standard “planar” projection with a uniform sampling rate. Producing a correct final image with traditional GPUs requires two steps—first, the GPU must render with a standard projection, generating more pixels than needed. Second, for each pixel location in the output display surface, look up a pixel value from the rendered result from the first step to apply to the display surface.
Without Lens Matched Shading, a VR headset renders a rectangle and then squeezes it to the dimensions of the display and lens.
| First-pass image |
Final image required for correct viewing |
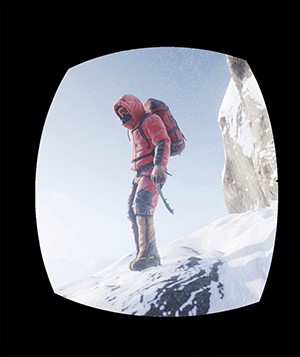
This process renders 86% more pixels than necessary, and it is this performance-sapping wastefulness that Lens Matched Shading fixes. To achieve this, Pascal’s Simultaneous Multi-Projection technology divides the original rectangle output into four quadrants, and adjusts them to the approximate shape of the final image.
| |
|
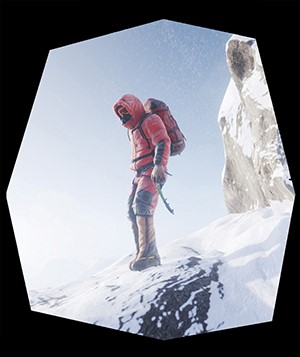

In technical terms, the final image shown in the headset is 1.1 Megapixels per eye, the first-pass image without Lens Matched Shading is 2.1 Megapixels per eye, and with Lens Matched Shading is just 1.4 Megapixels per eye. That's a 50% increase in throughput available for pixel shading, which translates into a 15% performance improvement over Multi-Res Shading, without any reduction in peripheral image quality.
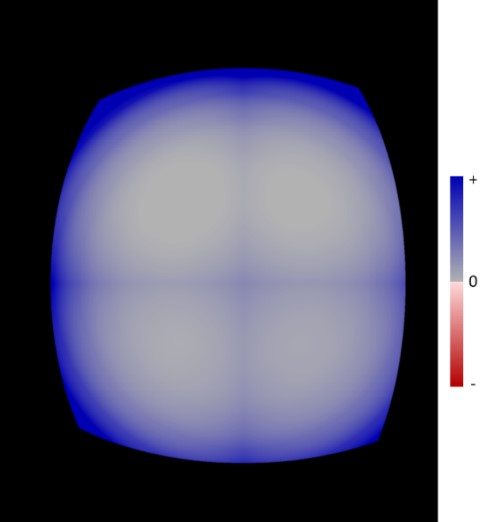
One step in determining the Lens Matched Shading parameters is to check the sampling rate compared to the sampling rate required for the final image. The objective for the default, “conservative”, setting of Lens Matched Shading is to always match or exceed the sampling rate of the final image. The image below demonstrates an example comparison for the preceding lens matched shading image.
| First Pass image sampling |
Blue indicates pixels that were sampled at a higher rate than required, gray indicates a matched rate, and any red pixels would indicate initial sampling that was below the rate in the final image. The absence of red pixels confirms that the setting matches the objective. In addition, developers have the option to use different settings; for example one could use a setting that is higher resolution in the center and undersampled in the periphery, to maximize frame rate without significant visual quality degradation. |
Single Pass Stereo

Traditionally, VR applications have to draw geometry twice —once for the left eye, and once for the right eye. Single Pass Stereo uses the new Simultaneous Multi-Projection architecture of NVIDIA Pascal-based GPUs to draw geometry only once, then simultaneously project both right-eye and left-eye views of the geometry. This allows developers to effectively double the geometric complexity of VR applications, increasing the richness and detail of their virtual world.
VR SLI
With VR SLI, multiple GPUs can be assigned a specific eye to dramatically accelerate stereo rendering. VR SLI even allows scaling for PCs with more than two GPUs.
VR SLI provides increased performance for virtual reality applications where multiple GPUs can be assigned to a specific eye (the same number of GPUs are assigned to each eye) to dramatically accelerate stereo rendering. With the GPU affinity API, VR SLI allows scaling for systems with >2 GPUs. VR SLI is supported for DirectX and OpenGL.
AFR SLI — Not Appropriate for VRAlternate-frame rendering (AFR) is the method used for SLI on traditional monitors. GPUs using AFR SLI trade off work on entire frames. In the case of two GPUs, the first GPU renders the even frames and the second GPU renders the odd frames. The GPU start times are staggered by a half-a-frame to maintain regular frame delivery to the display.
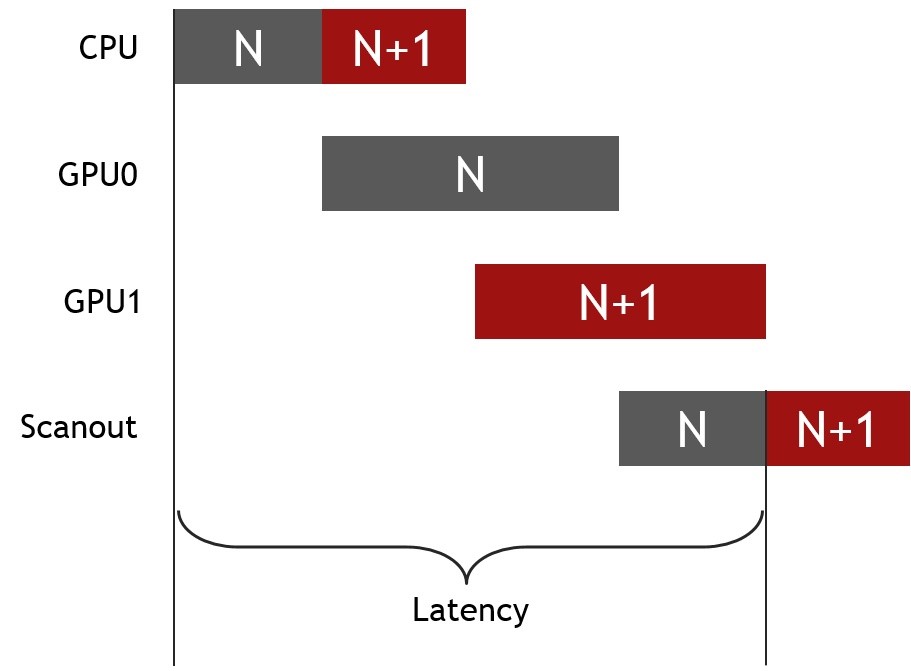
AFR SLI works reasonably well to increase frame rates relative to a single-GPU system, but it doesn’t help with latency. So this method is not the best model for VR.
How VRI SLI WorksA better way to use two GPUs for VR rendering is to split the work of drawing a single frame across both GPUs. With VR SLI, this means rendering the frames for each eye on their own individual GPU.
The frame for the left eye is rendered on the first GPU, and the frame for the right eye is rendered on the second GPU at the same time.

Parallelizing the rendering of the left- and right-eye frames across two GPUs yields a massive improvement in performance, allowing VR SLI to improve both frame rate and latency relative to a single-GPU system.
Note that unlike traditional AFR SLI, which uses a profile in the NVIDIA driver, VR SLI requires application side integration to enable performance scaling. VR SLI is now integrated into applications such as Valve’s The Lab, ILMxLAB’s Trials on Tatooine, and Croteam’s Serious Sam VR: The Last Hope, with many more in progress including UE4, Unity and Max Play engine integrations.
NVIDIA VRWorks Benchmarks With FCAT VR
If you’re using a GeForce GTX 10-Series GPU you can utilize all of our VRWorks technologies to improve performance and enhance image quality. Below, you can view benchmarks showing the benefits of Multi-Res Shading, Lens Matched Shading and VR SLI.
Everest VR | MRS and LMS
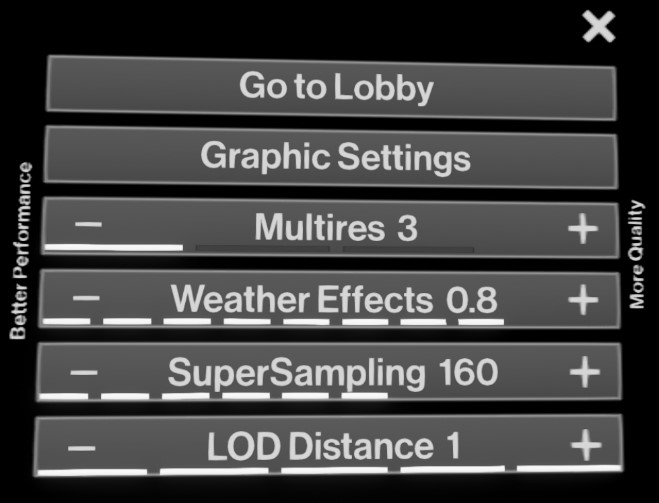
To access MRS settings in Everest VR, press the menu button on a Vive controller and select Graphic Settings. The Graphic Settings menu will appear and the first settings option will be Multires. Press the - or + button to toggle between the different MRS settings.
NOTE: The settings below were given names to more easily differentiate them by GPU.
| EVEREST VR MRS Settings | “Medium Settings” | “High Settings” |
| Recommended GPU | GTX 1060 | GTX 1080 |
| Weather Effects | 0.8 | 0.8 |
| Supersampling | 160 | 170 |
| LOD Distance | 1 | 1 |
| Everest VR is recommended with the following NVIDIA GeForce™ GTX Graphics cards: “Medium Settings”: GeForce 1060 “High Settings”: GeForce GTX 1080 or greater Supported VR Headsets: HTC Vive |
|
To access LMS settings in Everest VR, press the menu button on a Vive controller and select Graphic Settings. The Graphic Settings menu will appear and the first settings option will be Multires. Press the - or + button to toggle between the different LMS settings.
NOTE: The settings below were given names to more easily differentiate them by GPU.
| EVEREST VR MRS Settings | “Medium Settings” | “High Settings” |
| Recommended GPU | GTX 1060 | GTX 1080 |
| Weather Effects | 0.4 | 0.8 |
| Supersampling | 140 | 170 |
| LOD Distance | 1 | 1 |
The Settings Explained
Lens Matched Shading (LMS): NVIDIA specific optimization that provides performance improvements in pixel shading by avoiding the rendering of pixels that end up being discarded in the final view sent to the HMD after the distortion process. MRS is supported by Maxwell and Pascal architecture GPUs.
Weather Effects: This controls the amount of particle effects used throughout the experience to simulate weather. The default value is 0.4, while 0.0 turns them off. Higher values will result in more dramatic effects.
SuperSampling: By default, Unreal renders into a screen buffer that is 40% higher than the Vive display and scales the result down to the native resolution. This results in crisper textures. This default setting is displayed as 140. Increasing the screen percentage will result in increasingly crisper images, but at the cost of performance. High-end GPUs should have room to increase this significantly.
LOD Distance: Geometry has a series of increasingly higher levels of detail based on the distance from the viewer. This multiplier affects at what distance higher density geometry is activated. Lower is better.
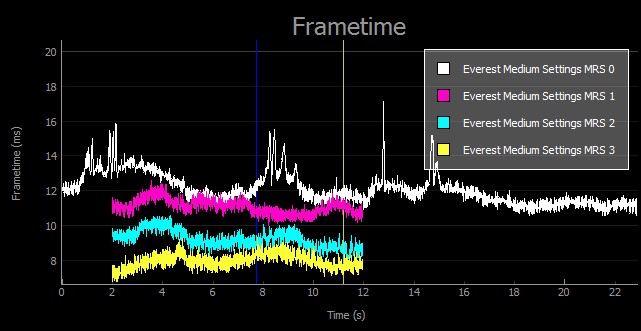
Everest | FCAT VR MRS ChartsThe following charts show a comparison of MRS settings across the GTX 1060, GTX 1080, and GTX 1080 Ti GPUs. This data was captured using the FCAT VR Software Capture Tool, which captures and analyzes dropped frames and warp misses in VR gameplay. The FCAT VR Data Analyzer was used to generate the charts.
Everest MRS with GTX 1060 | “Medium Settings”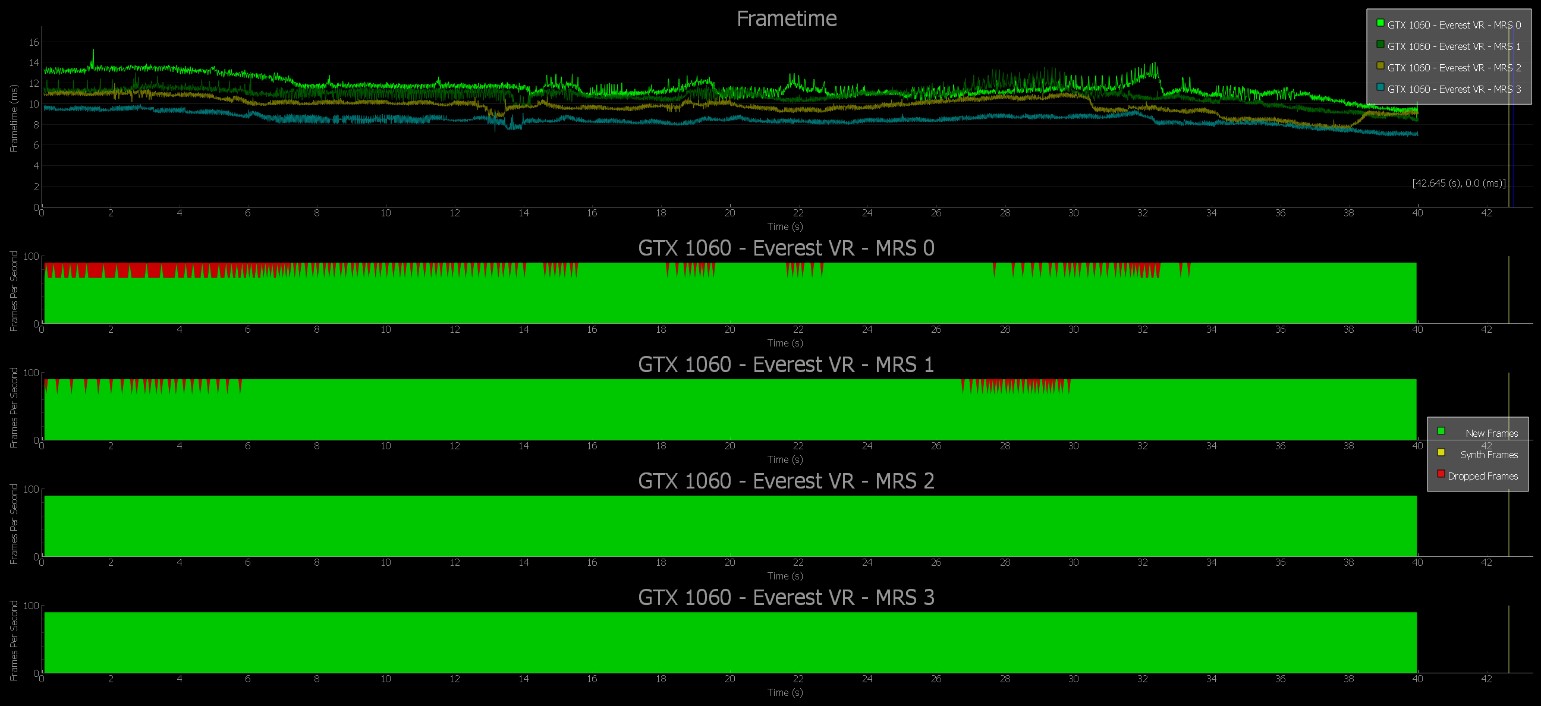
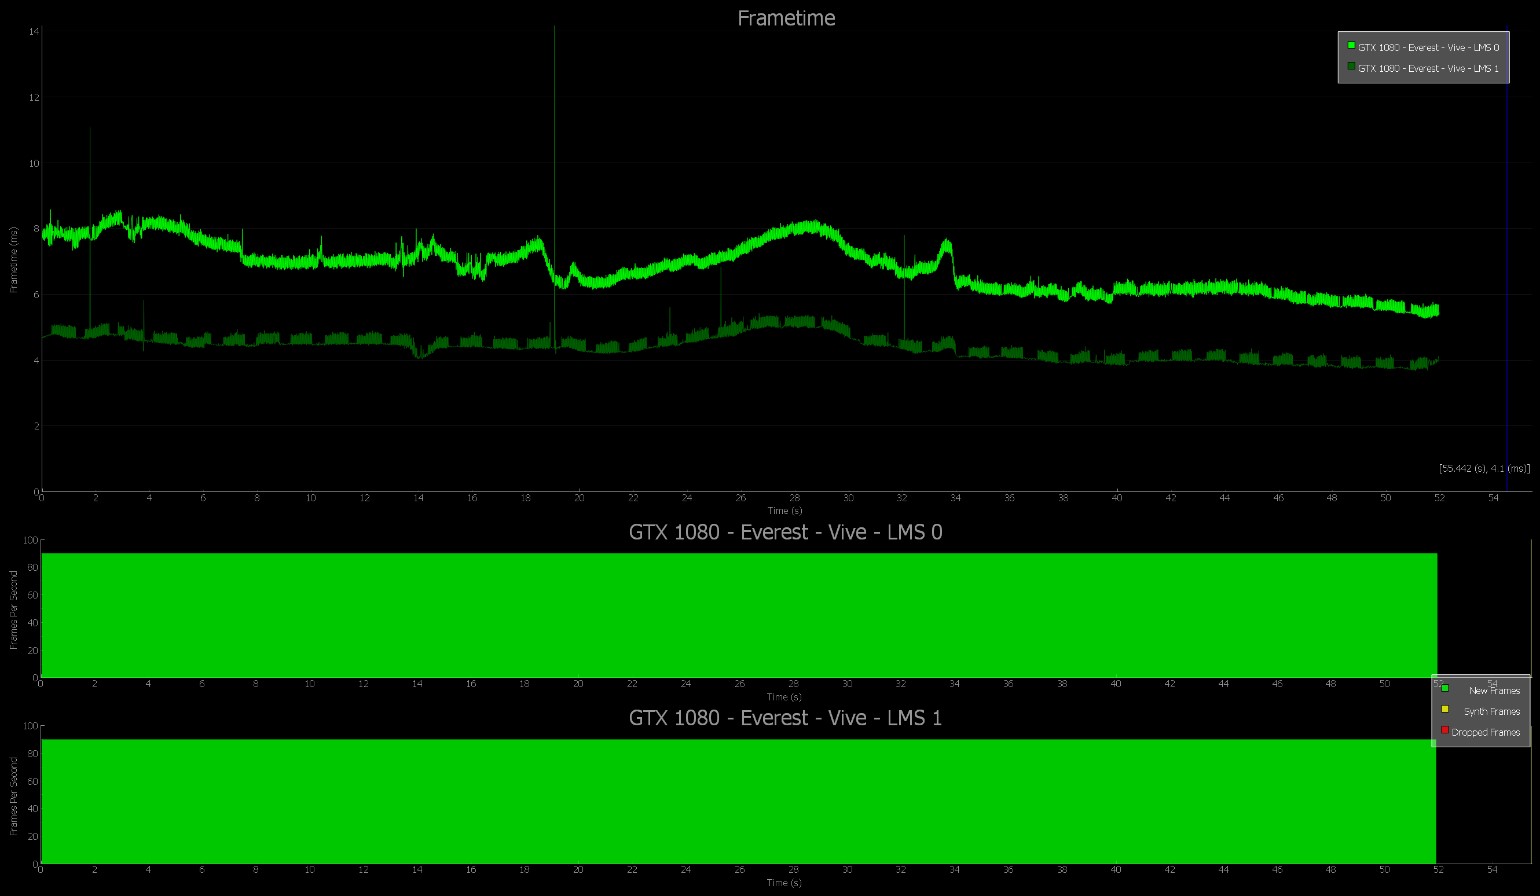
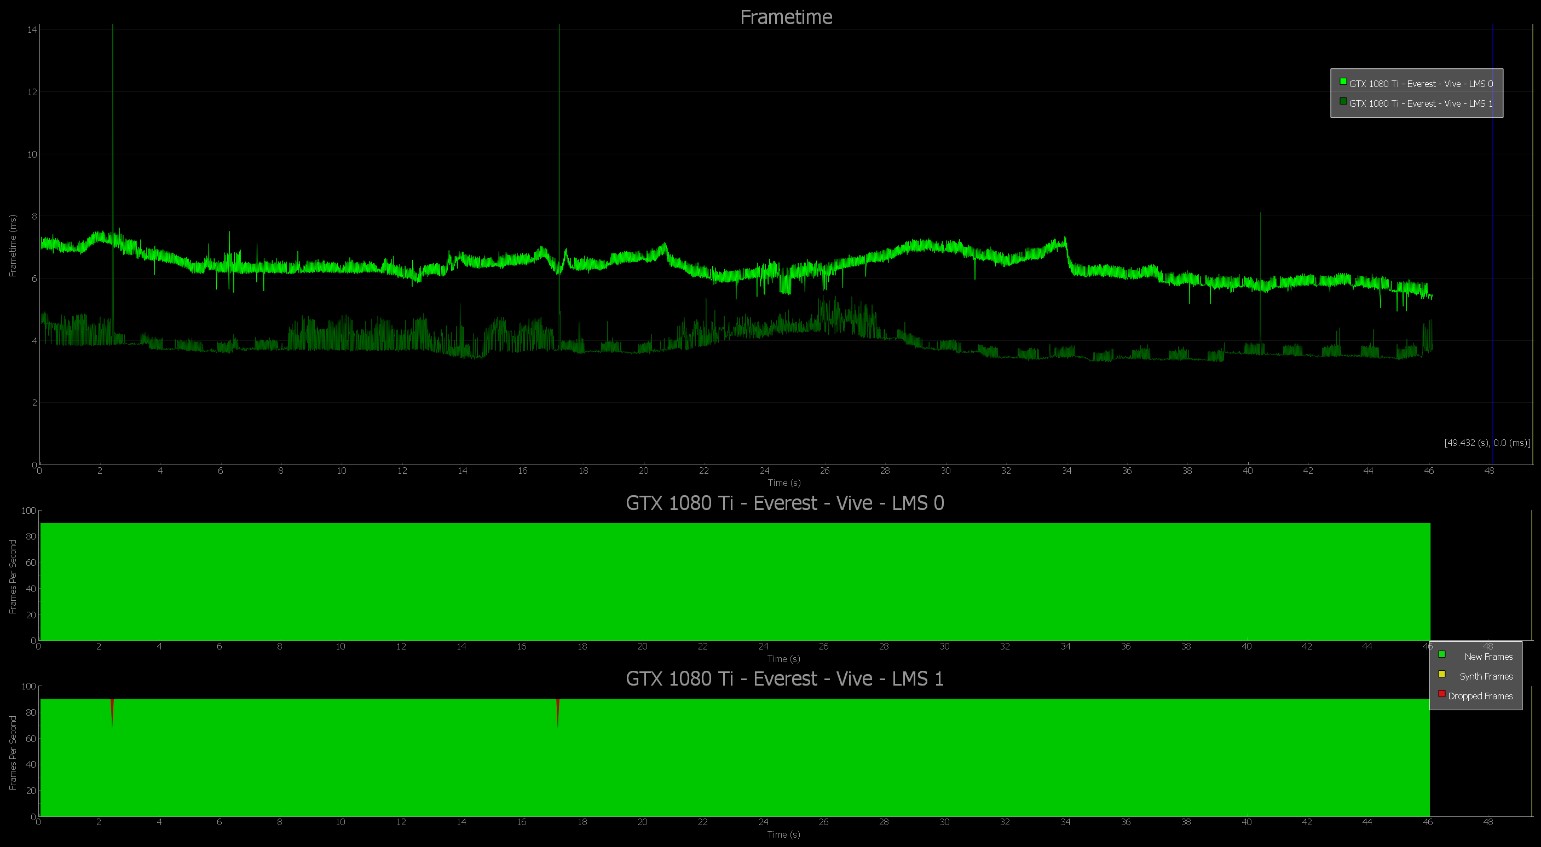
The following charts show a comparison of LMS settings across the GTX 1060, GTX 1080, and GTX 1080 Ti GPUs. This data was captured using the FCAT VR Software Capture tool, which captures and analyzes dropped frames and warp misses in VR gameplay. The FCAT VR Data Analyzer was used to generate the charts.
Everest LMS with GTX 1060 | “Medium Settings”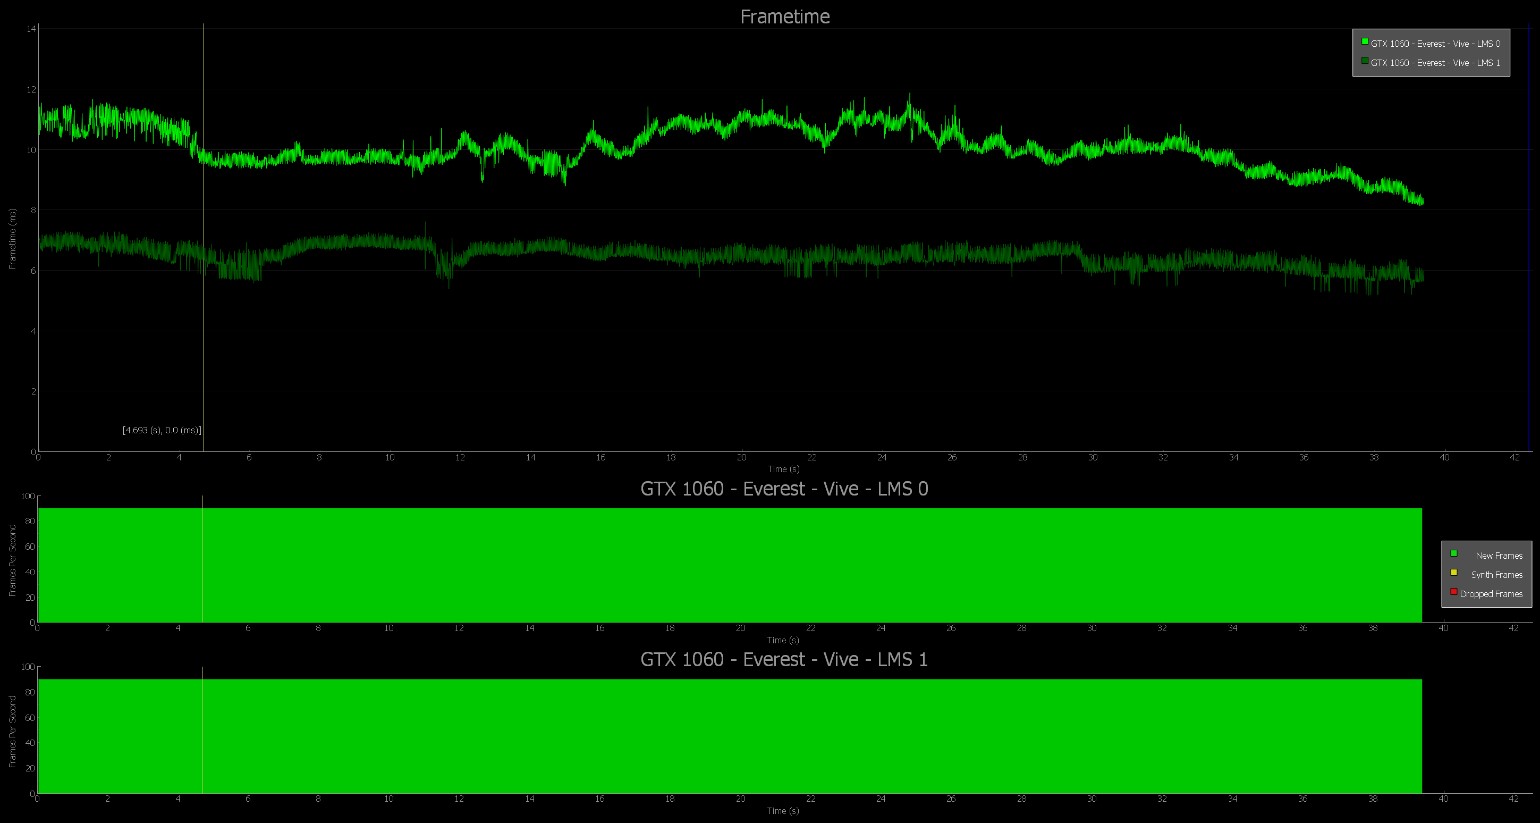
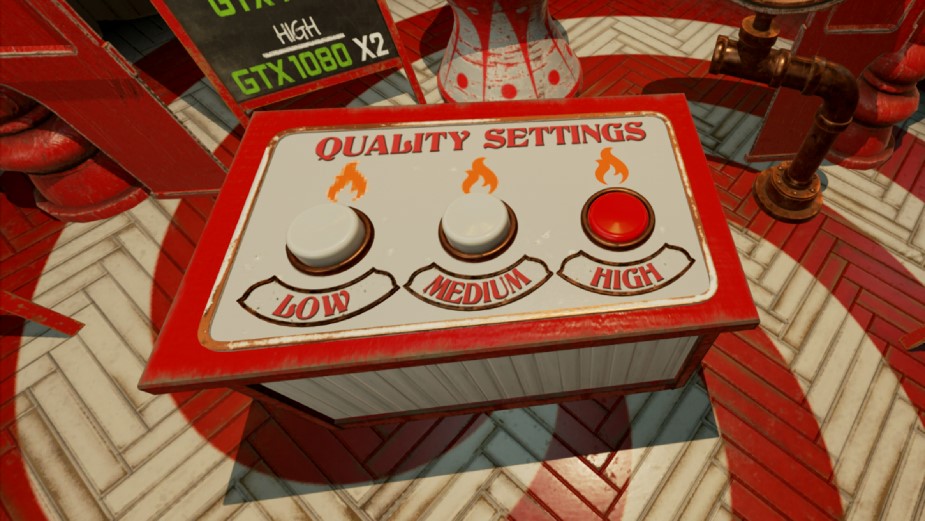
NVIDIA VR Funhouse | MRS
VR Funhouse features the hottest simulation and rendering technologies, all supporting an incredibly engaging VR game.
VR Funhouse is built using the Unreal Engine and features the following technologies used in AAA game development:
- Destruction: Destroy rigid bodies
- HairWorks: The best hair and fur in the business
- Flow: Volumetric fire and smoke
- FleX: Particle based physics liquids and solids
- VRWorks: Advanced VR rendering techniques for faster performance
Settings Used:
NOTE: These settings were chosen to best show MRS scaling.
|
 |
In order to modify MRS settings in VR Funhouse, you must obtain a particular build of VR Funhouse. Follow this procedure:
- Subscribe to NVIDIA VR Funhouse on Steam.
- In Steam, right click on NVIDIA VR Funhouse and select Properties.
- Select the Betas tab
- Select the beta list drop down arrow.
- Select ‘1.3.3-1157350-vrworks-mrs’ branch.
- Steam will automatically download the different beta branch that includes numpad keys to change MRS levels.
Changing the MRS Settings in VR Funhouse Once you successfully obtained the 1.3.3-1157350-vrworks-mrs build of VR Funhouse, then you can use the following numpad keys to change the MRS level while in game. Type the following for each of the MRS Levels:
-
MRS 0: Num0
MRS 1: Num1
MRS 2: Num2
MRS 3: Num3
CRITICAL NOTE: Settings get reset every time a new level is started. Make sure to set your MRS level again before testing.
Benchmark VR Funhouse
The MRS settings automatically change every time a scene (mini game) is changed. So ensure that you select the appropriate MRS level at the beginning of every scene.
Run-to-run variance can pose a significant problem when running benchmarks in VR, especially for scenarios which involve chance. For this reason, we recommend that the Clown Painter scene for benchmarking VR Funhouse. Follow this procedure:
- Launch NVIDIA VR Funhouse from Steam.
- From the opening scene, select the Settings button on the right.
- Choose the appropriate settings level.
- Push the number 1 button on your keyboard to load the Clown Painter scene.
- Select the appropriate MRS level by pushing the corresponding number on the numpad.
- Begin recording your benchmark with FCAT VR Software Capture.
- Use one hand to shoot a goo gun into a clown mouth until the balloon breaks or the gun runs out of goo.
- Stop shooting from that hand to let the goo gun recharge.
- Use the other hand to continue shooting goo into a clown mouth.
- Repeat this alternating pattern for 30 – 60 seconds. The idea is to always have goo shooting and interacting with the geometry in the scene.
- Stop the benchmark.
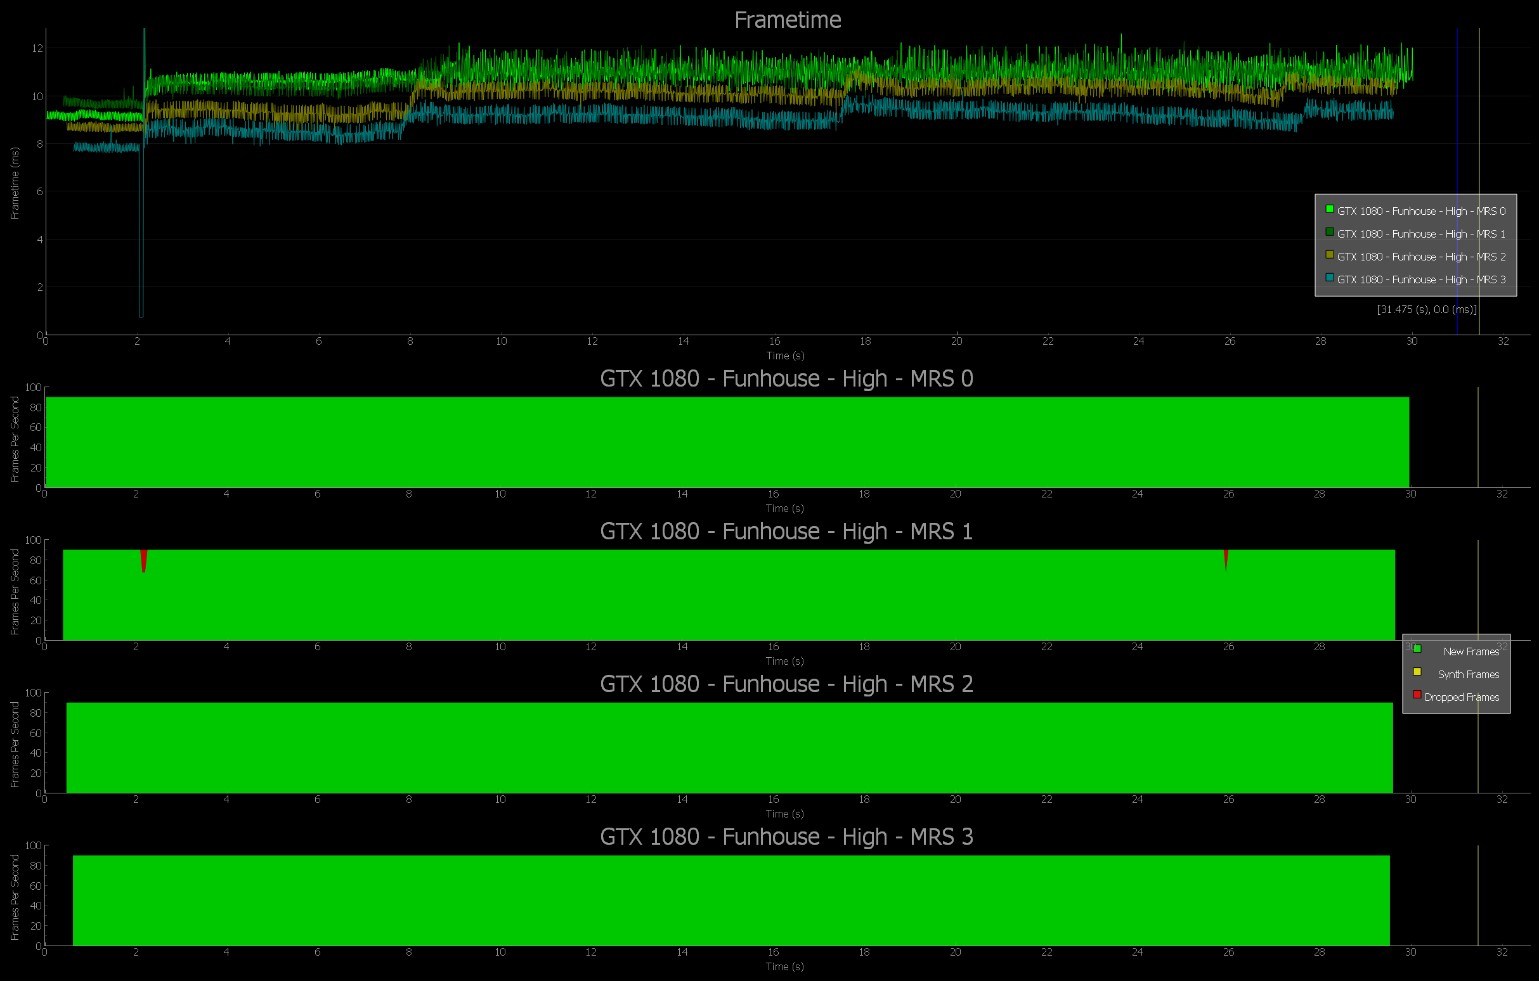
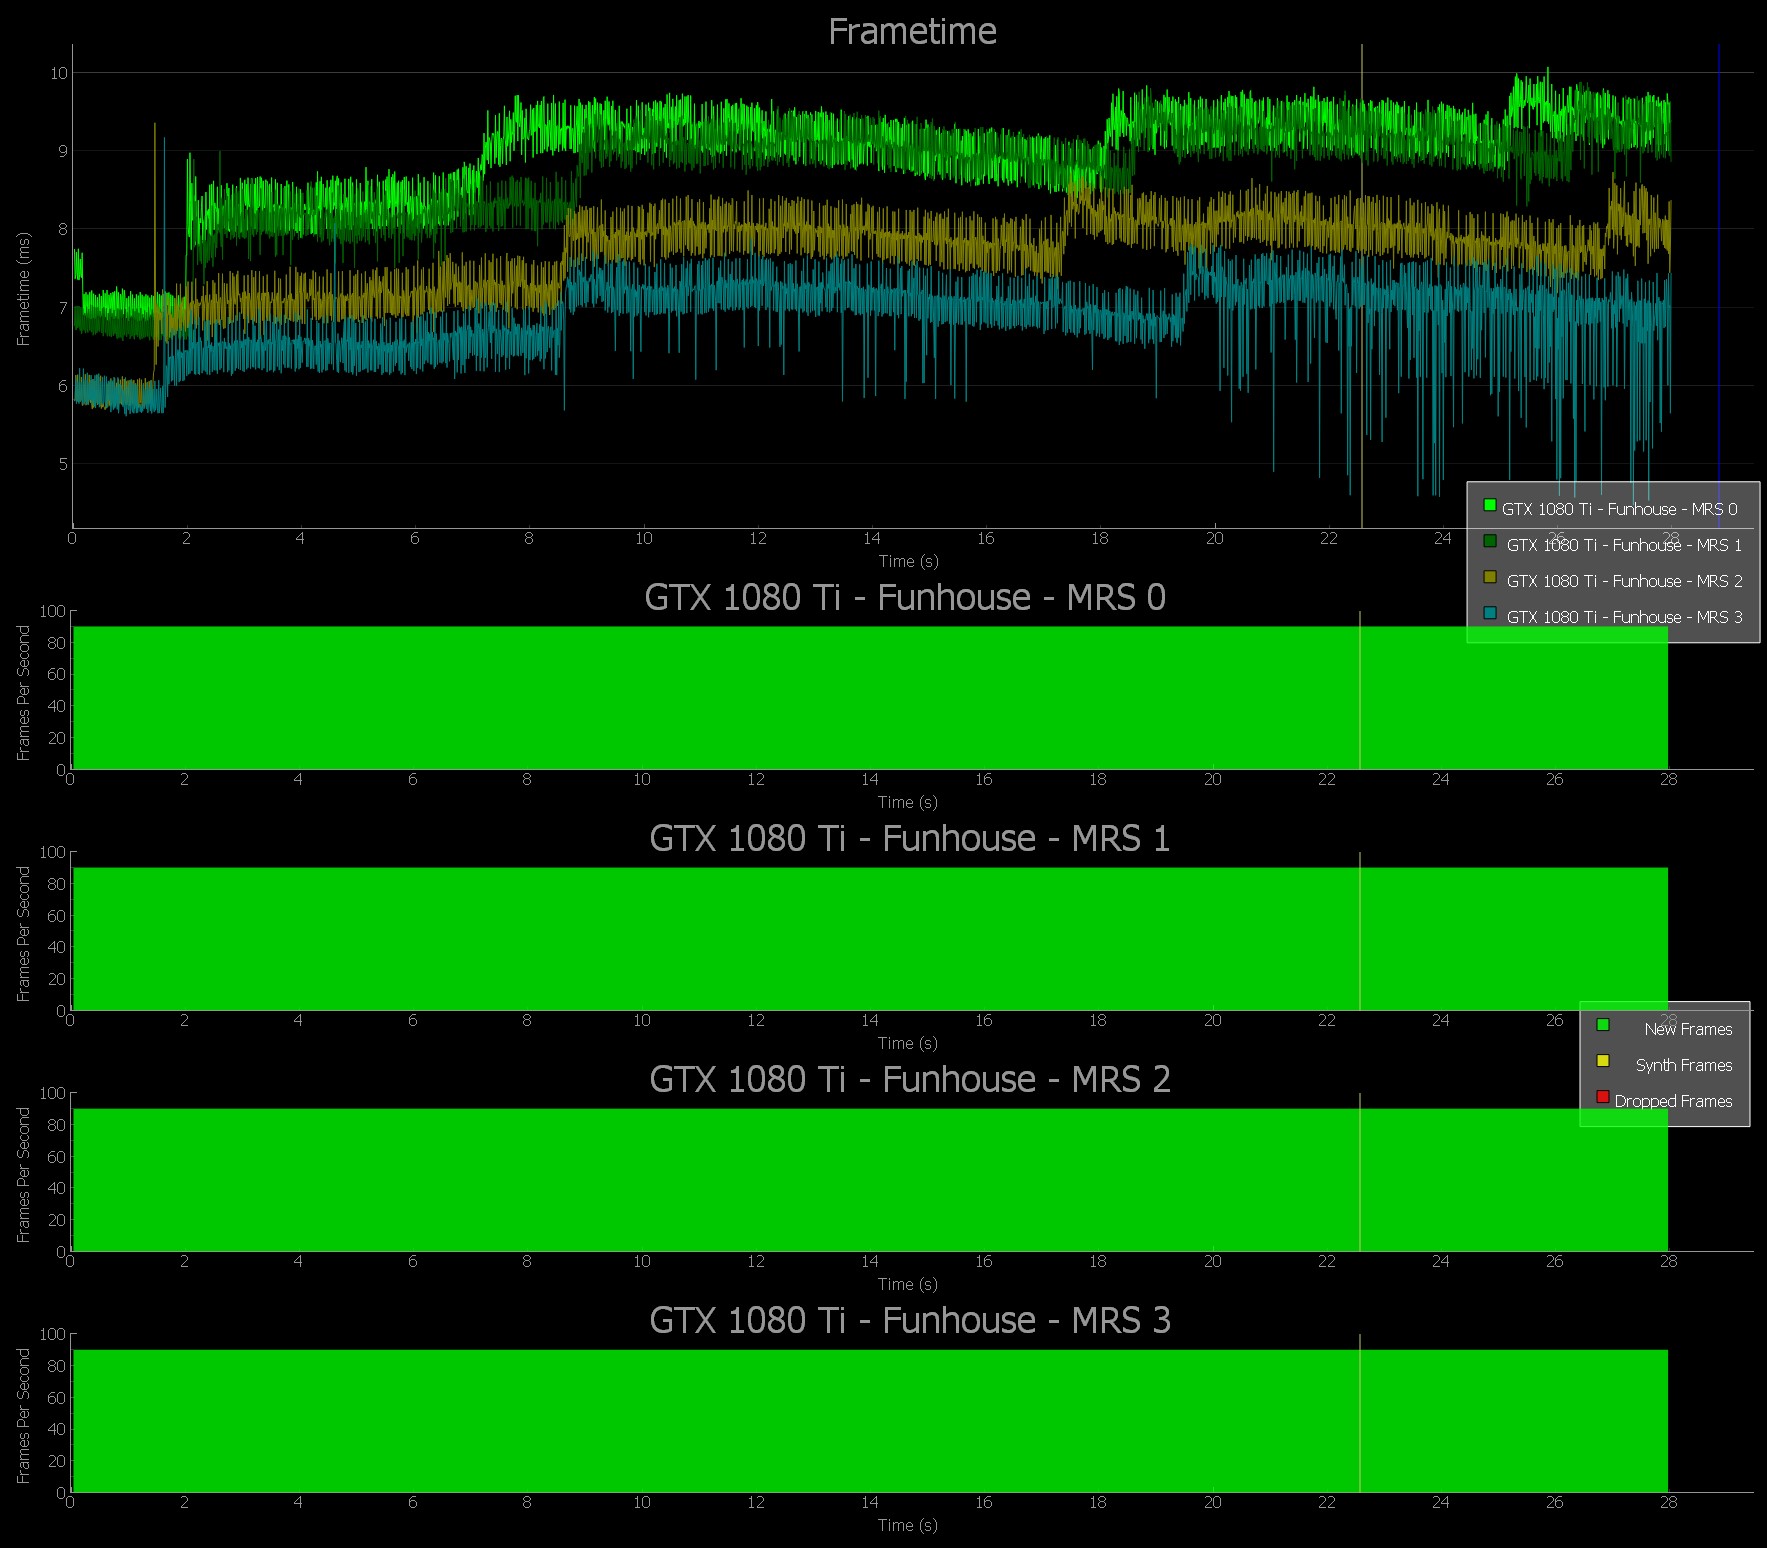
The following charts show a comparison of MRS settings across the GTX 1060, GTX 1080, and GTX 1080 Ti GPUs. This data was captured using the FCAT VR Software Capture tool, which captures and analyzes dropped frames and warp misses in VR gameplay. The FCAT VR Analyzer was used to generate the charts.
VR Funhouse MRS with GTX 1060 | Low Settings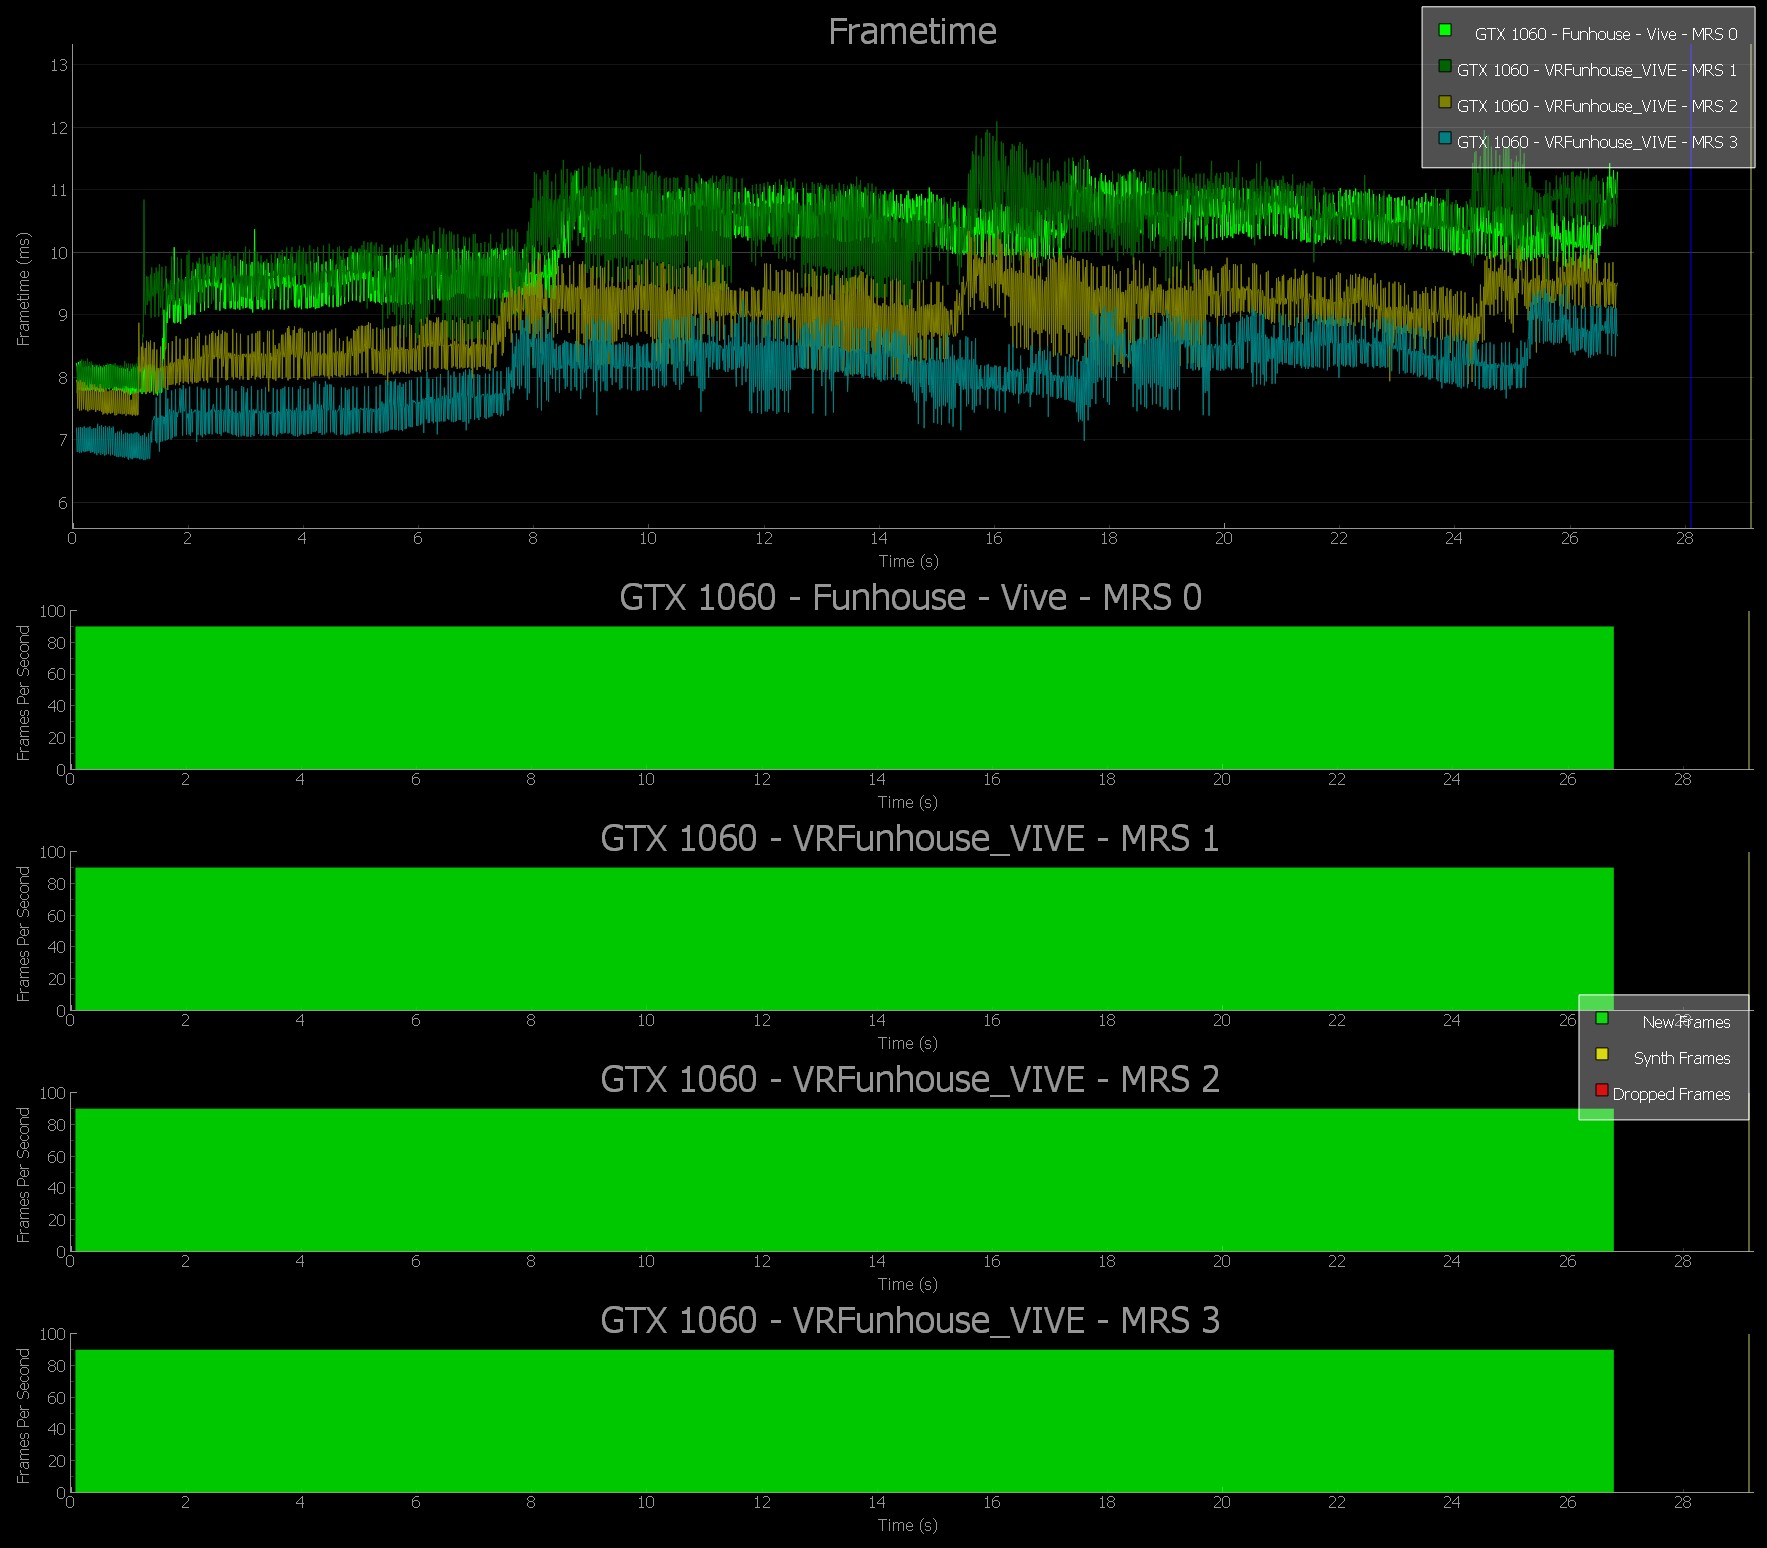
Sports Bar VR | MRS
Sports Bar VR VR demonstrates more than just how pool physics will be experienced in the VR space. Players will be able to interact with all sorts of objects, create trick shots with any plates, bottles and other items in the pool hall, play virtual darts, and take part in the time-honored pastime of throwing empty beer bottles against the wall.
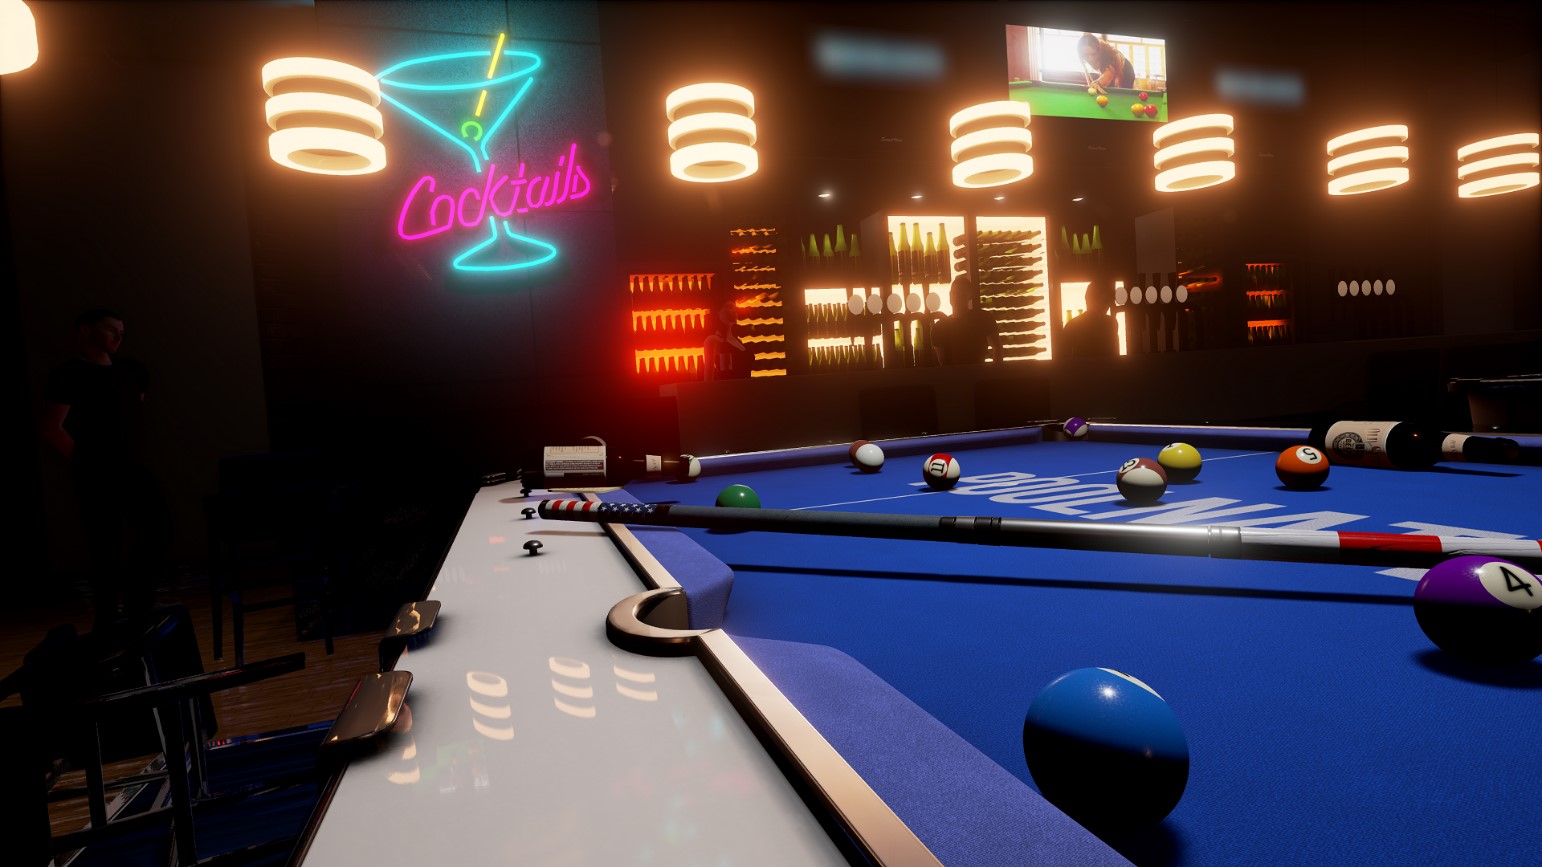
With the most advanced proprietary physics engine honed for billiards realism, Sports Bar VR VR aims to deliver the most interactive VR pool experience in the most chilled VR hangout.
Sports Bar VR | MRS Hardware RequirementsSettings Used:
Consider the following Super Sampling and Sharpening settings after selecting the presets below.
| Sports Bar VR MRS Presets | MEDIUM | ULTRA |
| Recommended GPU | GTX 1060 | GTX 1080 |
| Graphics Setting | Medium | Ultra |
| Super Sampling | 170 | 170 |
| Sharpening | 7 | 7 |
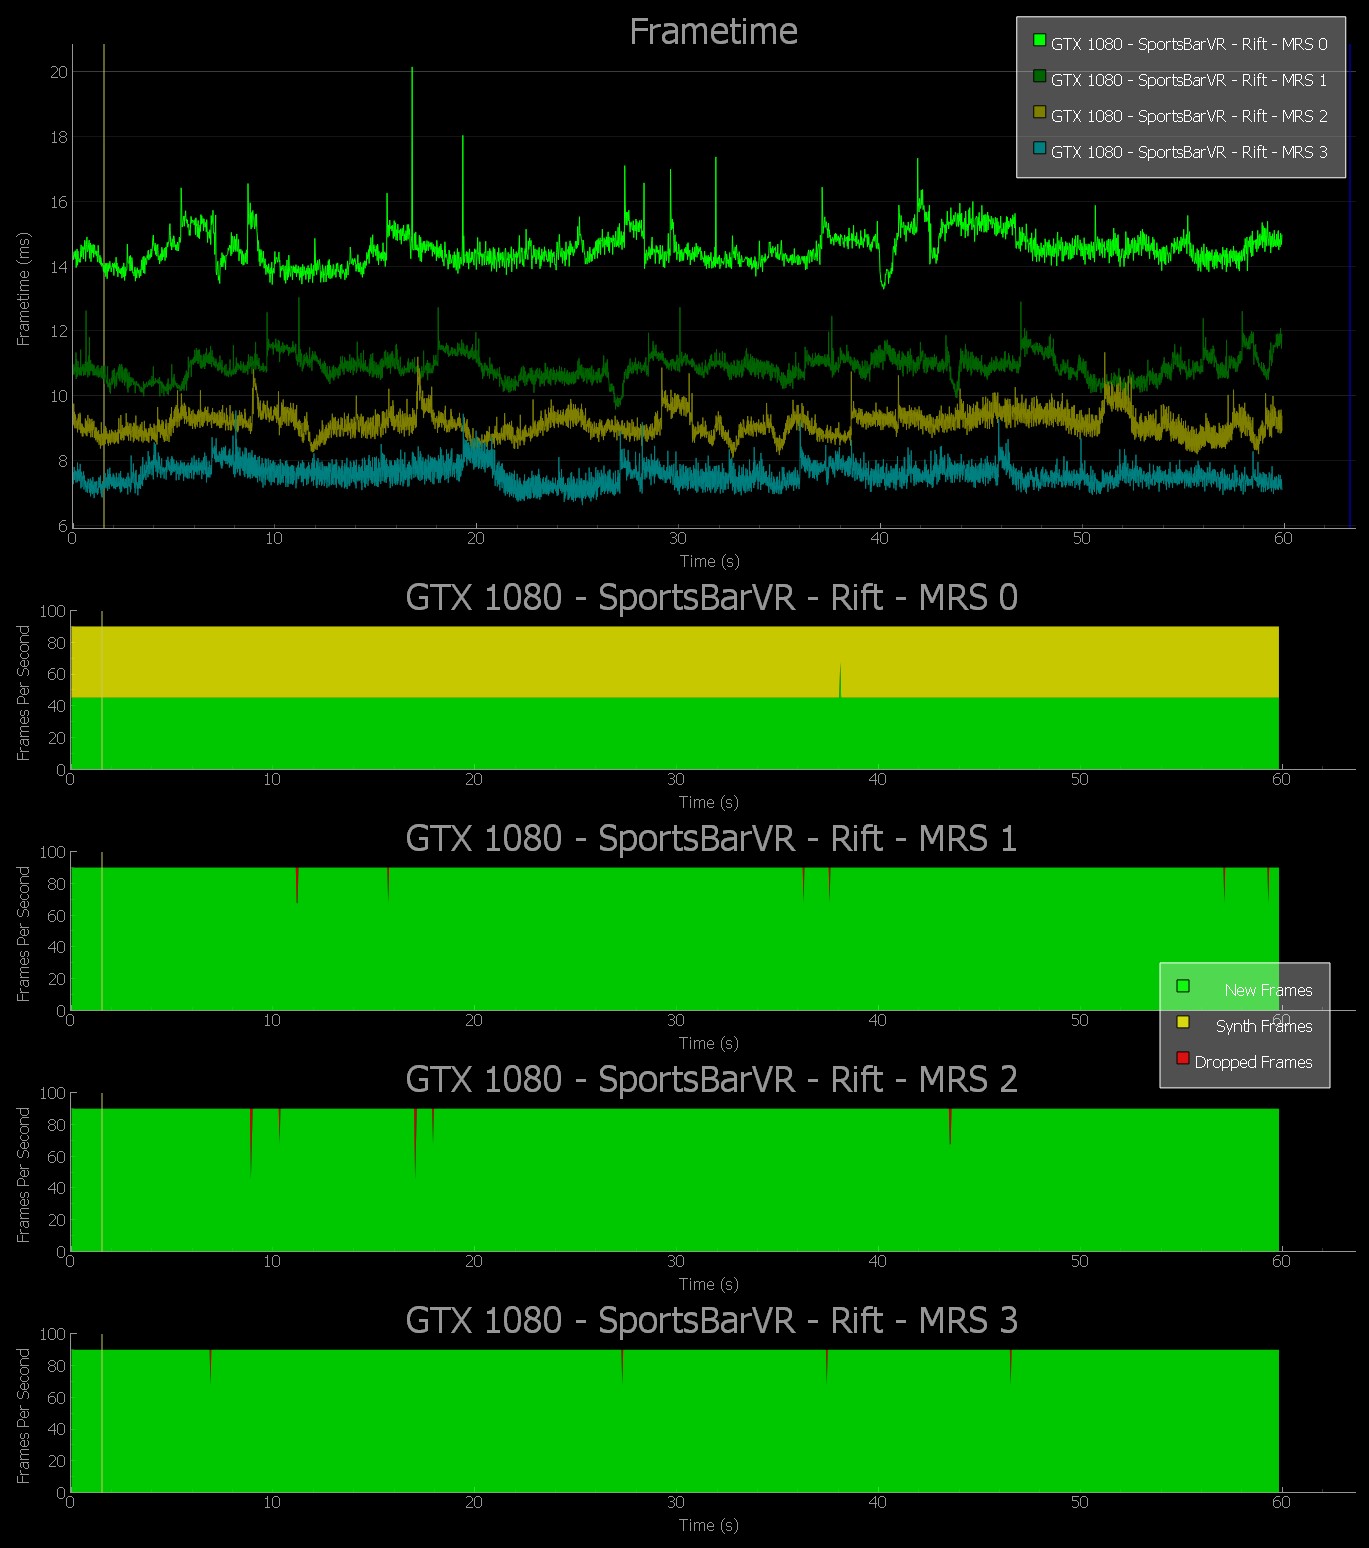
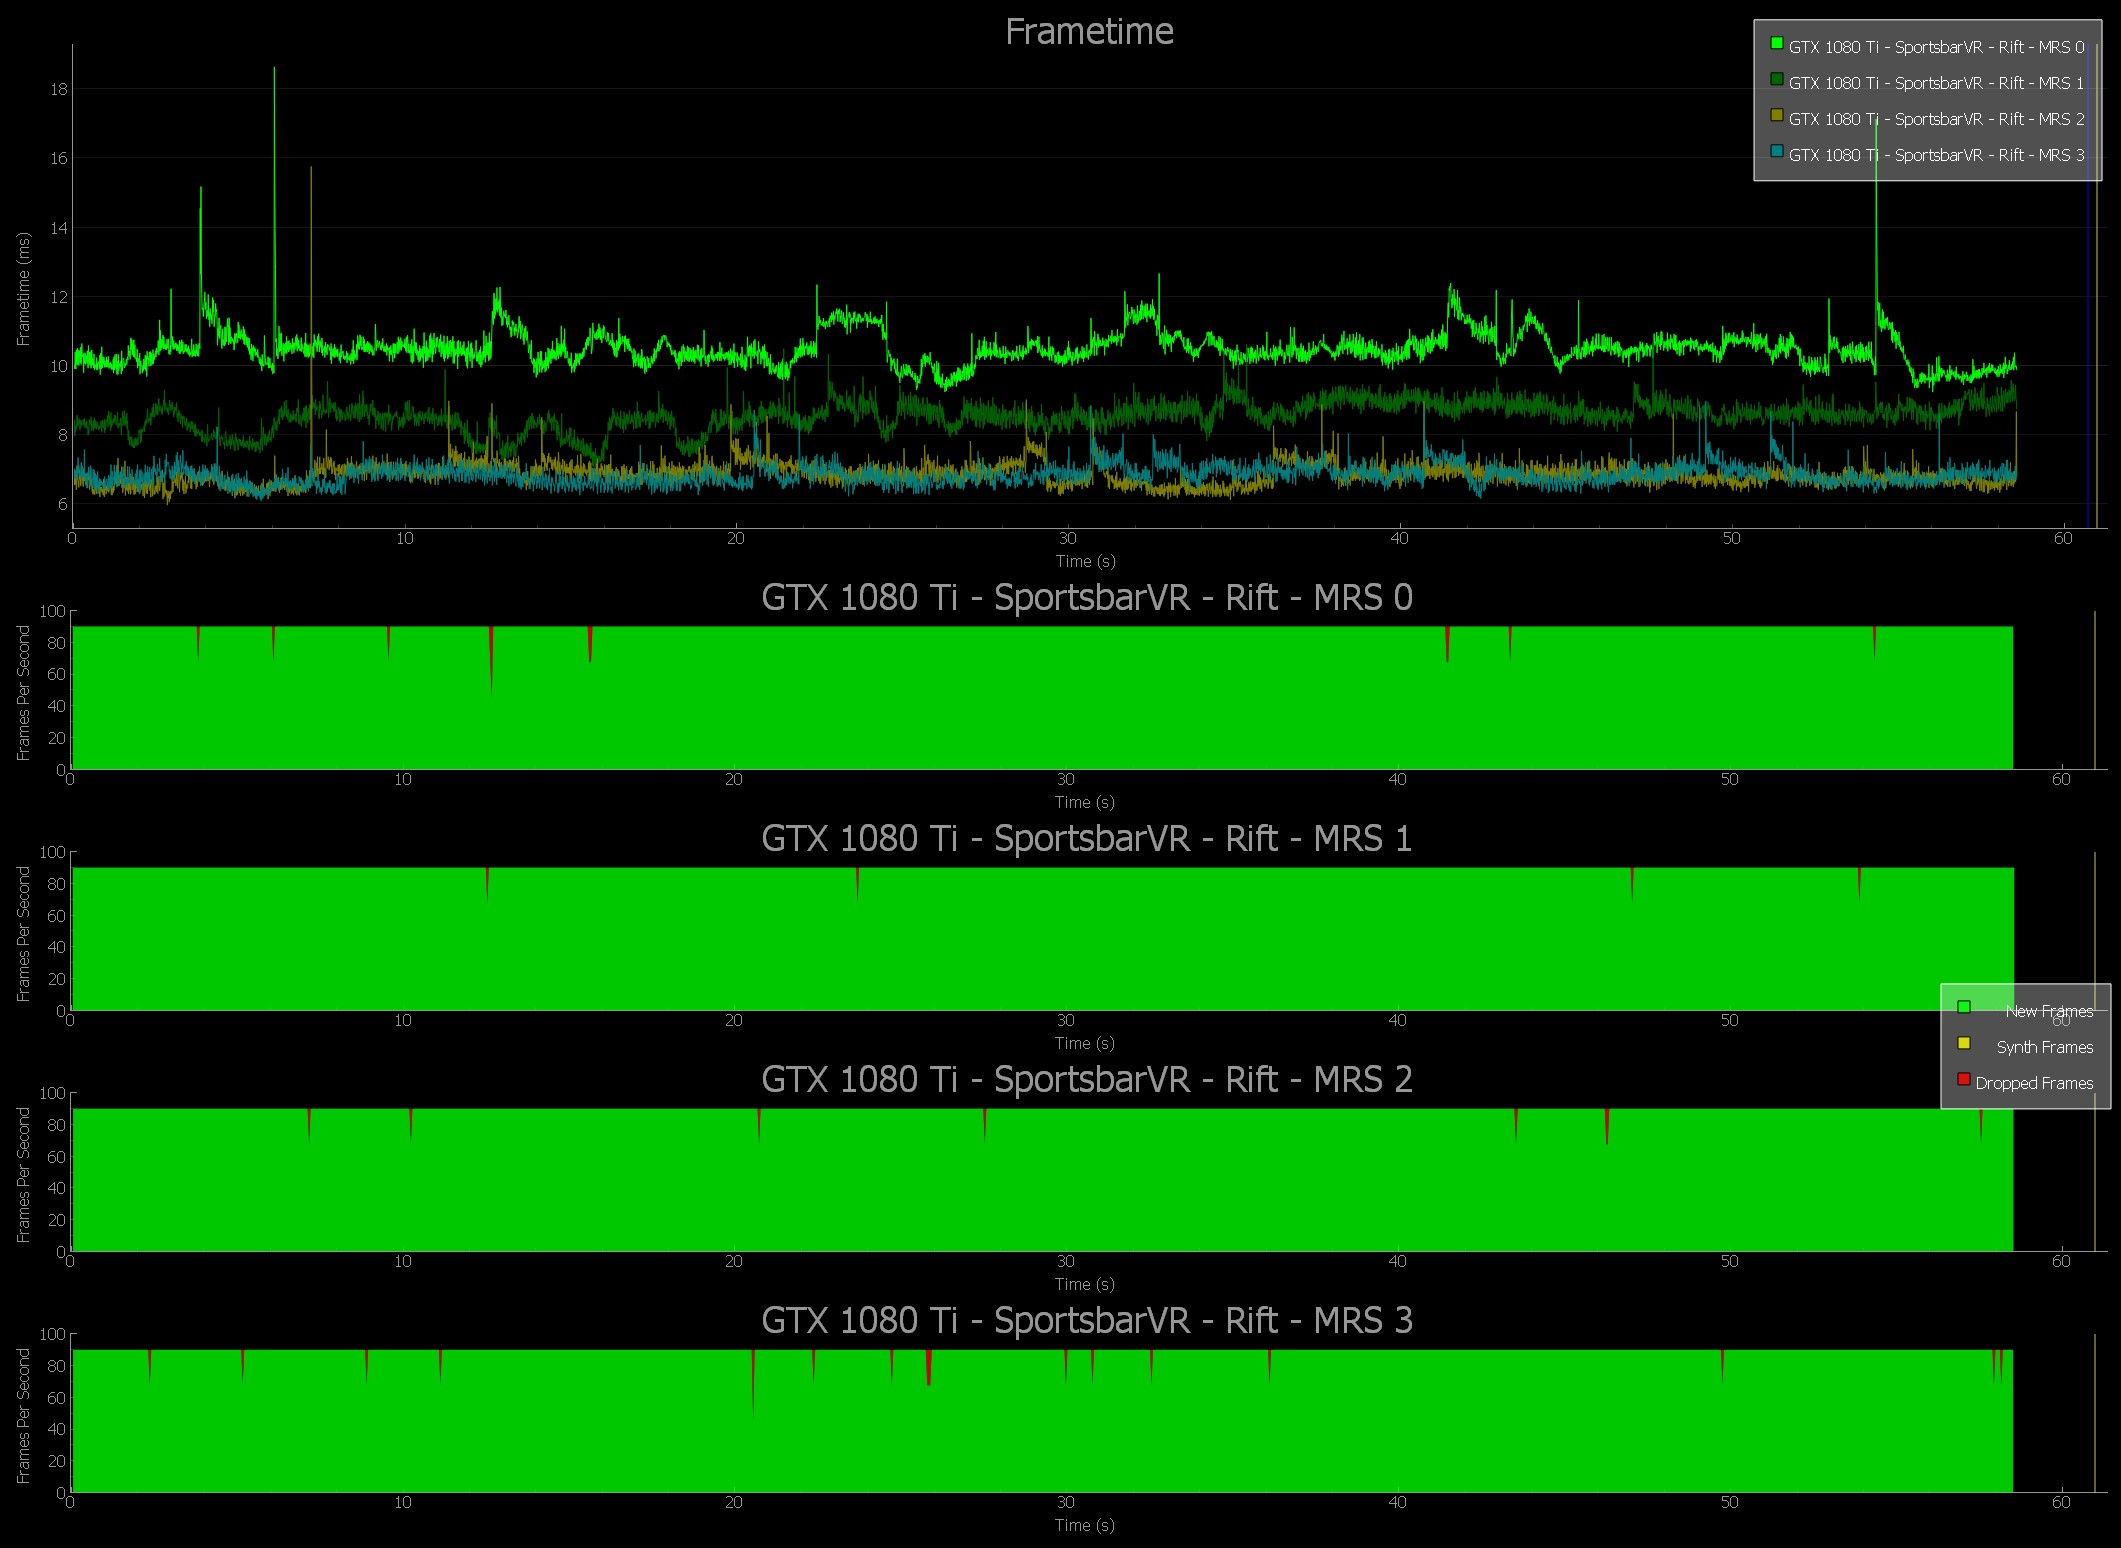
MRS settings reduce instances of dropped frames and warp misses on the GTX 1080. With MRS2 settings, dropped frames and warp misses are eliminated entirely.
Adjusting the MRS level in Sports Bar VRMRS levels in Sports Bar VR can be adjusted by pressing CTRL + 0, 1, 2, 3. MRS level 0 is considered “disabled.” MRS level has an inverse relationship with GPU rendering time and dropped frames: As MRS level increases, GPU rendering time and number of dropped frames decreases, providing a better user experience with little or no observable difference in image quality.
- MRS 0: CTRL + 0 (MRS off)
MRS 1: CTRL + 1 (MRS Level 1)
MRS 2: CTRL + 2 (MRS Level 2)
MRS 3: CTRL + 3 (MRS Level 3)
Caution: Do NOT use the numpad keys when changing MRS levels. Numpad keys may cause Oculus Rift to change ASW modes which will invalidate your test results.
NOTE: SportsBarVR may launch with MRS enabled by default. If you plan to test the effects of MRS, explicitly choose the MRS level for each test.
The following charts show a comparison of MRS settings across the GTX 1060, GTX 1070, and GTX 1080 GPUs. This data was captured using the FCAT VR Software Capture Tool, which captures and analyzes dropped frames and warp misses in VR gameplay. The FCAT VR Data Analyzer was used to generate the charts.
Sports Bar VR MRS with GTX 1060 | Medium Settings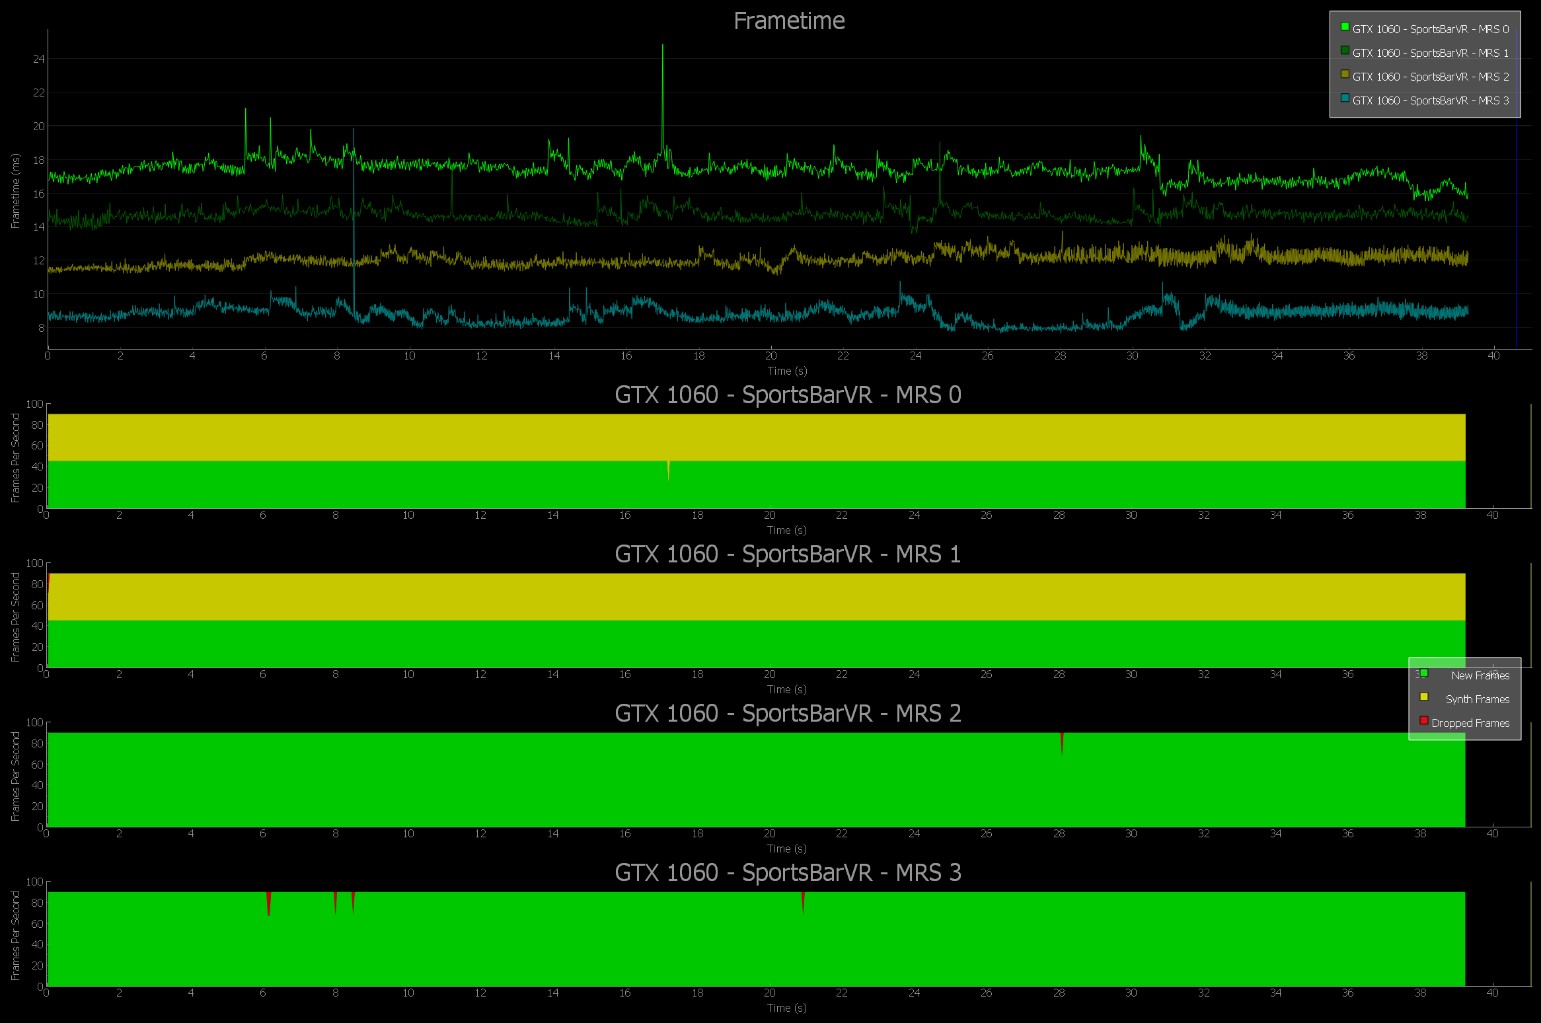
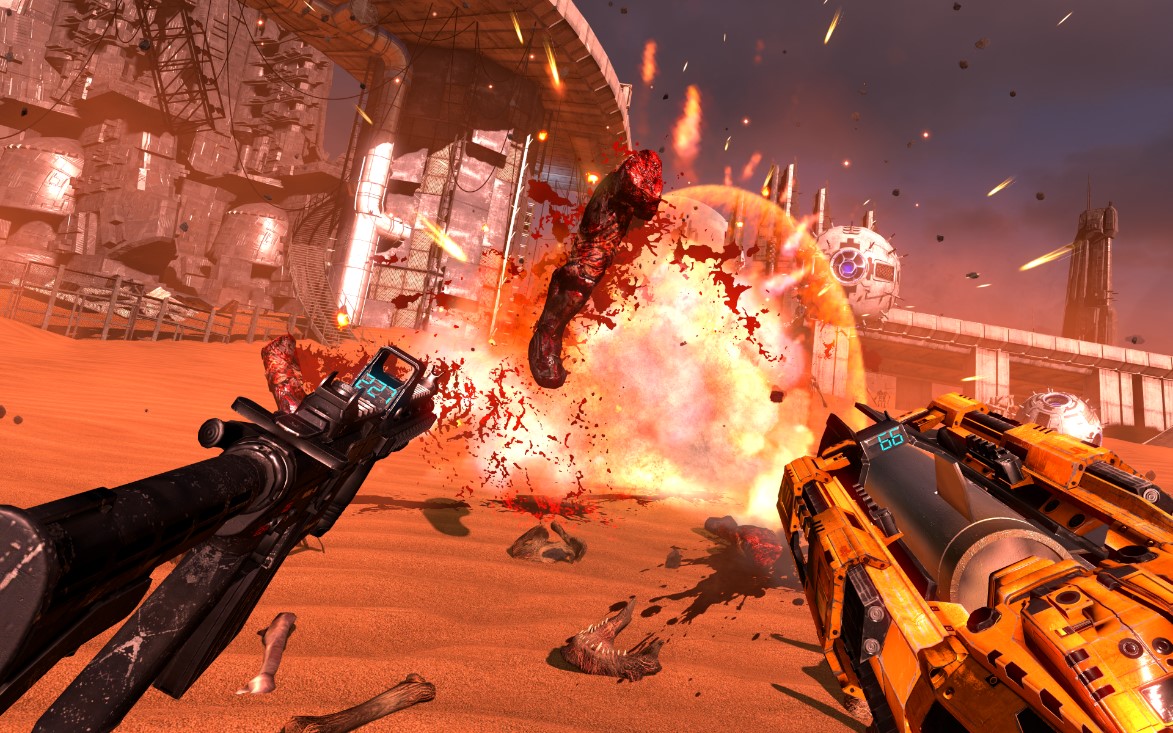
Raw Data | MRS
Neo-Shinjuku—2271. The massive and seemingly benevolent Eden Corporation owns the world. The elite hacker resistance movement SyndiK8 has unearthed the sinister reality behind Eden Corp’s newest line of robotic products. As one of SyndiK8’s top operatives, your mission is simple: infiltrate Eden Tower, steal one geopbyte of data, and get out alive—bringing Eden Corp down in your wake.
Built from the ground up for virtual reality, Raw Data’s action combat gameplay, intuitive controls, challenging enemies, and sci-fi atmosphere will completely immerse you within the game world. Go solo—or team up with a friend—and become the adrenaline-charged heroes of your own futuristic technothriller. You will put your wits, boldness, and endurance to the test.
Active VR gameplay turns you into a controller, with instant reflex access to an arsenal of advanced weapons and cutting-edge nanotech powers. Shared spaces with avatars and motion tracking encourage players to physically communicate through body language and environment interaction.
Raw Data | MRS Hardware Requirements
Go to Raw Data’s main menu, select Options, then Graphics. The last entry under the graphics settings will be Multi-Res Level. You can select from these MRS settings: Off, 1, 2, and 3.
Settings Used:
|
 |
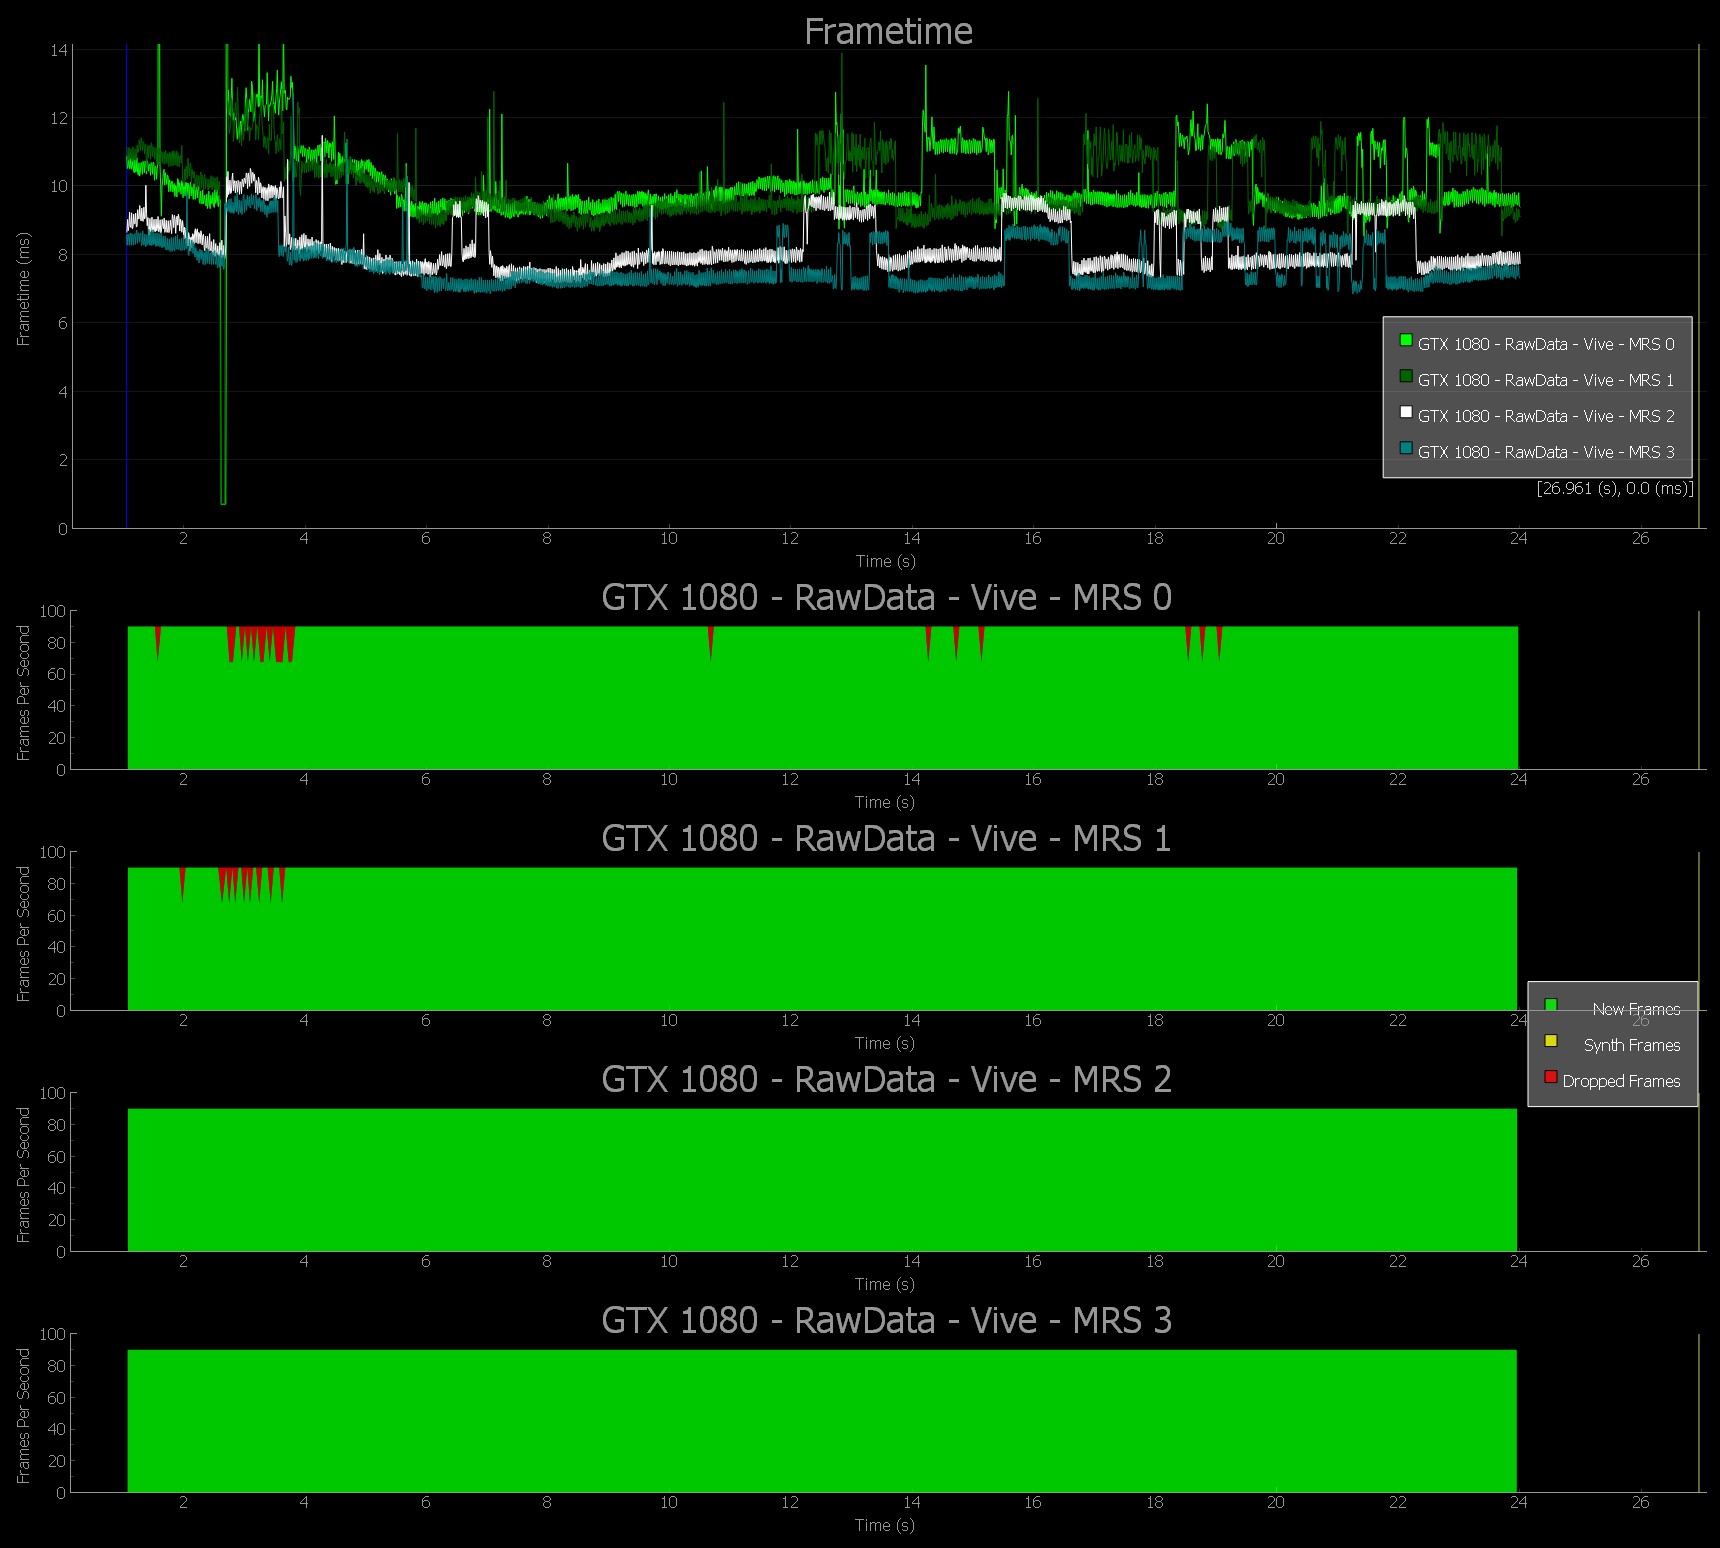
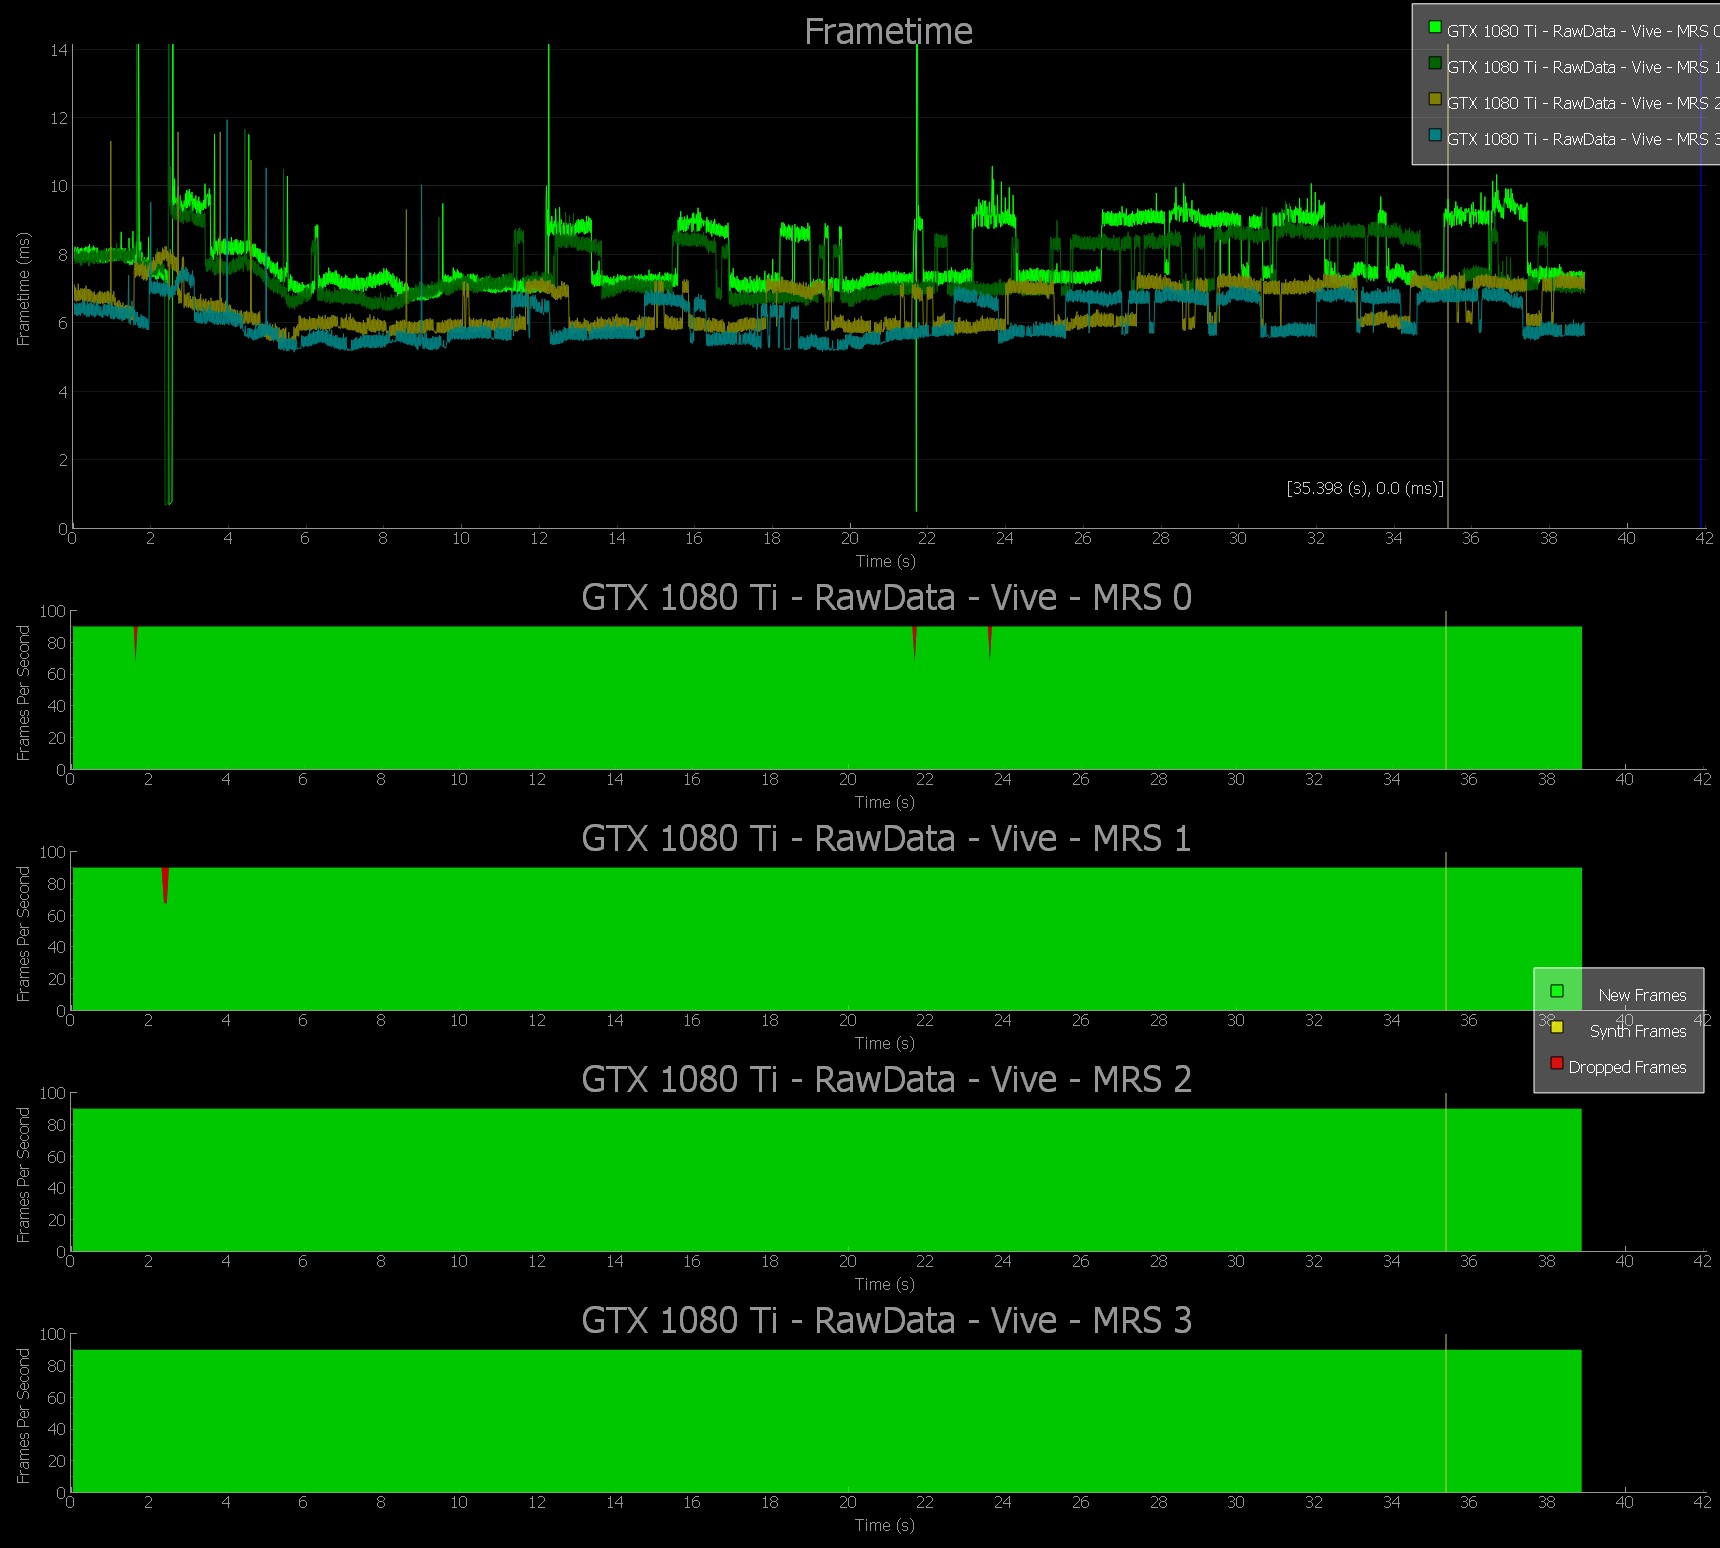
The following charts show a comparison of MRS settings across the GTX 1060, GTX 1080, and GTX 1080 Ti GPUs. This data was captured using the FCAT VR Software Capture tool, which captures and analyzes dropped frames and warp misses in VR gameplay. The FCAT VR Data Analyzer was used to generate the charts.
Raw Data with GTX 1060 | Low Settings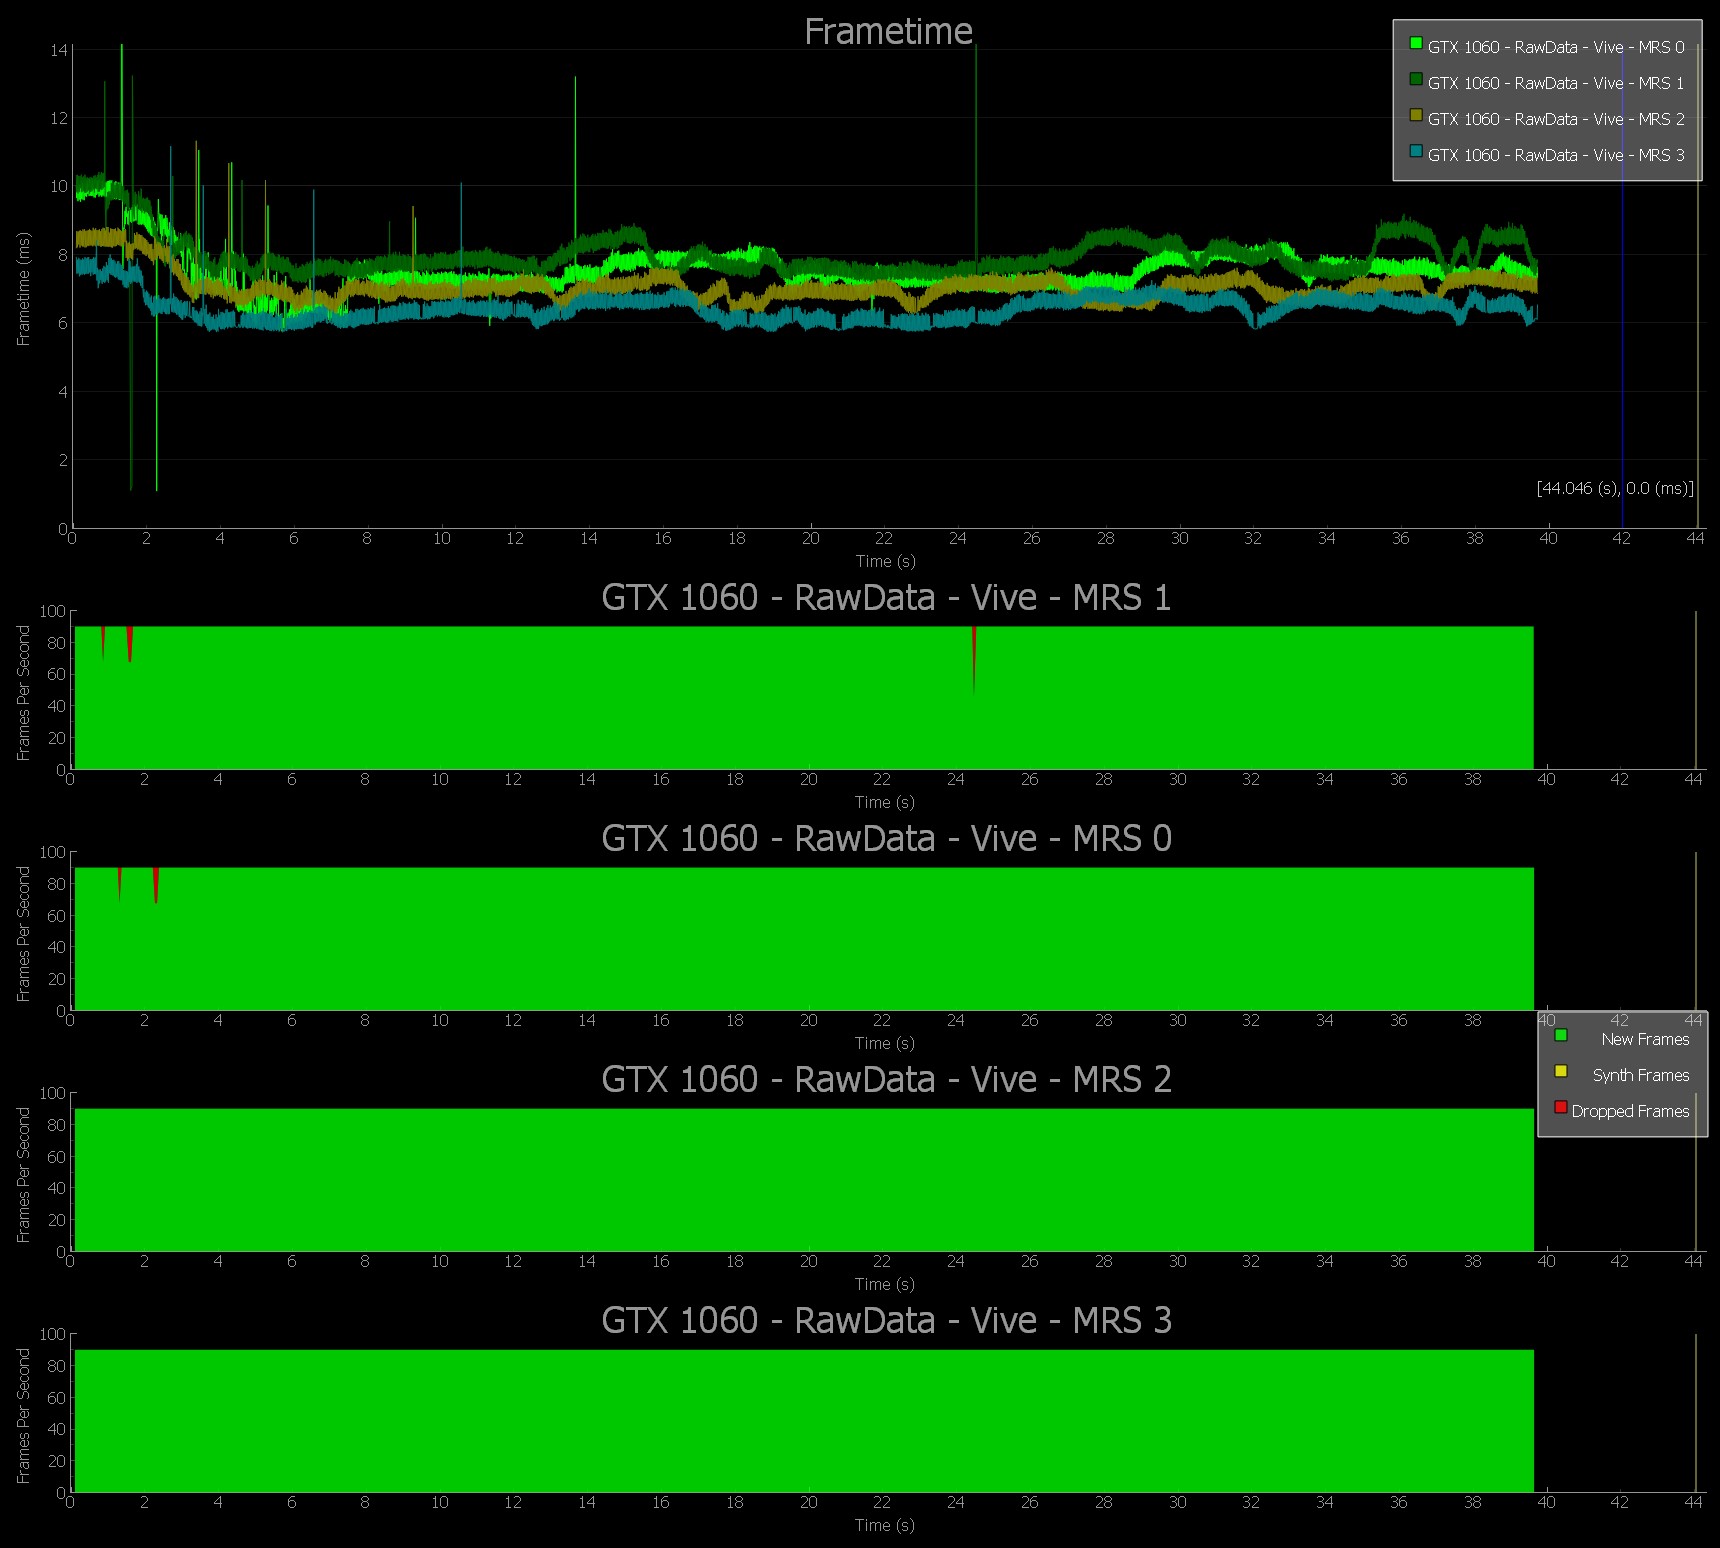
VR SLI provides increased performance for virtual reality apps where multiple GPUs can be assigned a specific eye to dramatically accelerate stereo rendering. With the GPU affinity API, VR SLI allows scaling for systems with more than two GPUs.
Serious Sam VR: The Last Hope | VR SLI
Simulating physics takes incredible processing power, and we found it by applying NVIDIA VRWorks technologies, including Multi-Res Shading and VR SLI, to increase rendering performance.
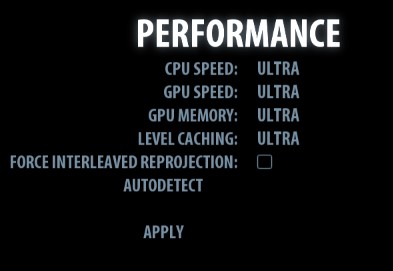
From the Serious Sam VR: The Last Hope main menu, slect Options, then Performance.
Settings Used:
NOTE: These settings were chosen to best show VR SLI scaling.
|
 |
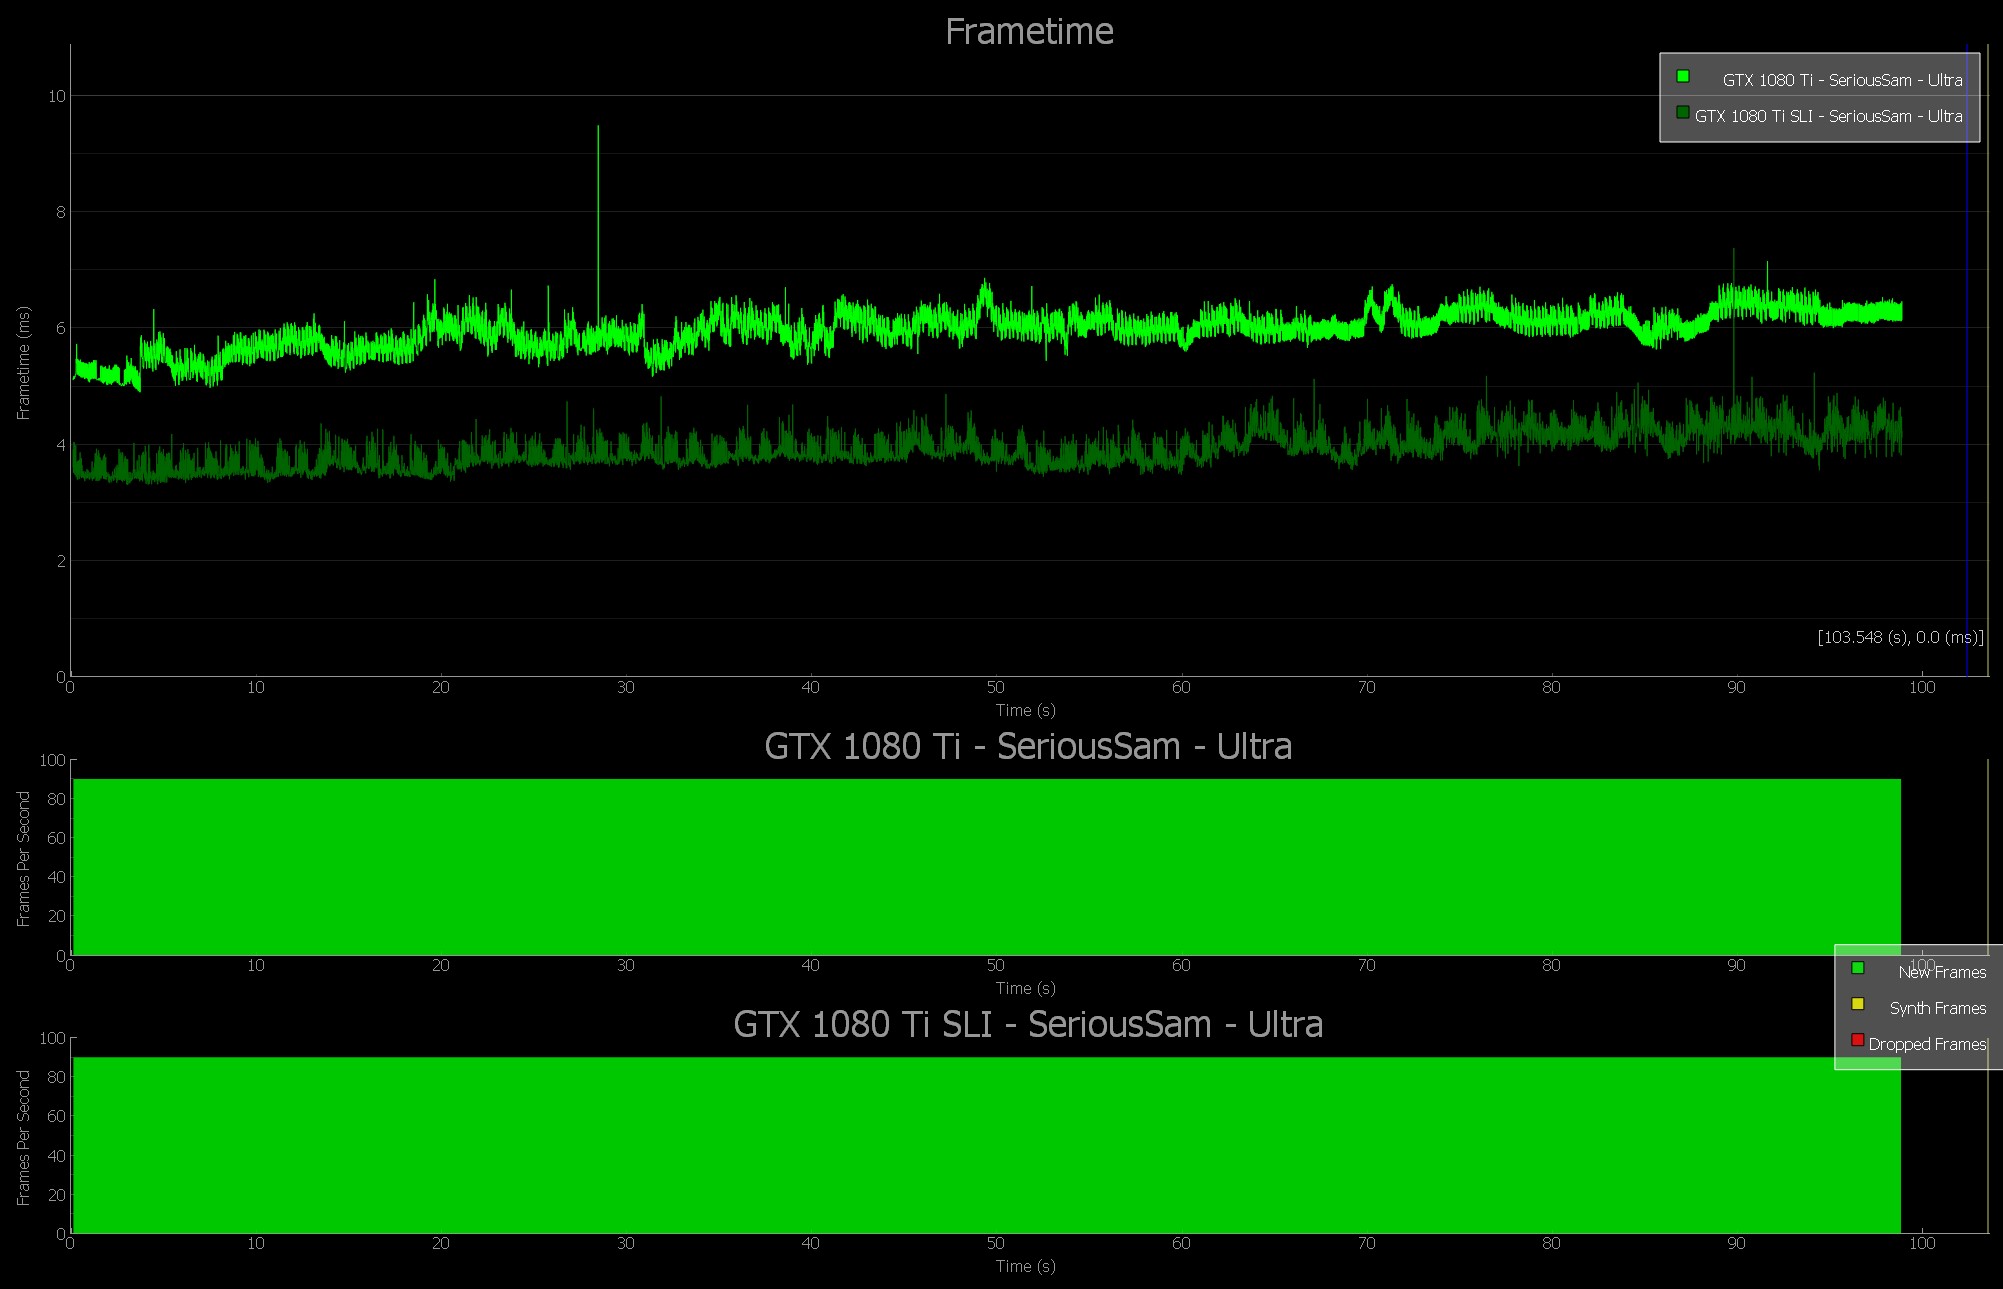
The following charts show a comparison of MRS settings across the GTX 1080 and GTX 1080 Ti GPUs. This data was captured using the FCAT VR Software Capture tool, which captures and analyzes dropped frames and warp misses in VR gameplay. The FCAT VR Data Analyzer was used to generate the charts.
Serious Sam VR Single vs. SLI GTX 1080 | Ultra Settings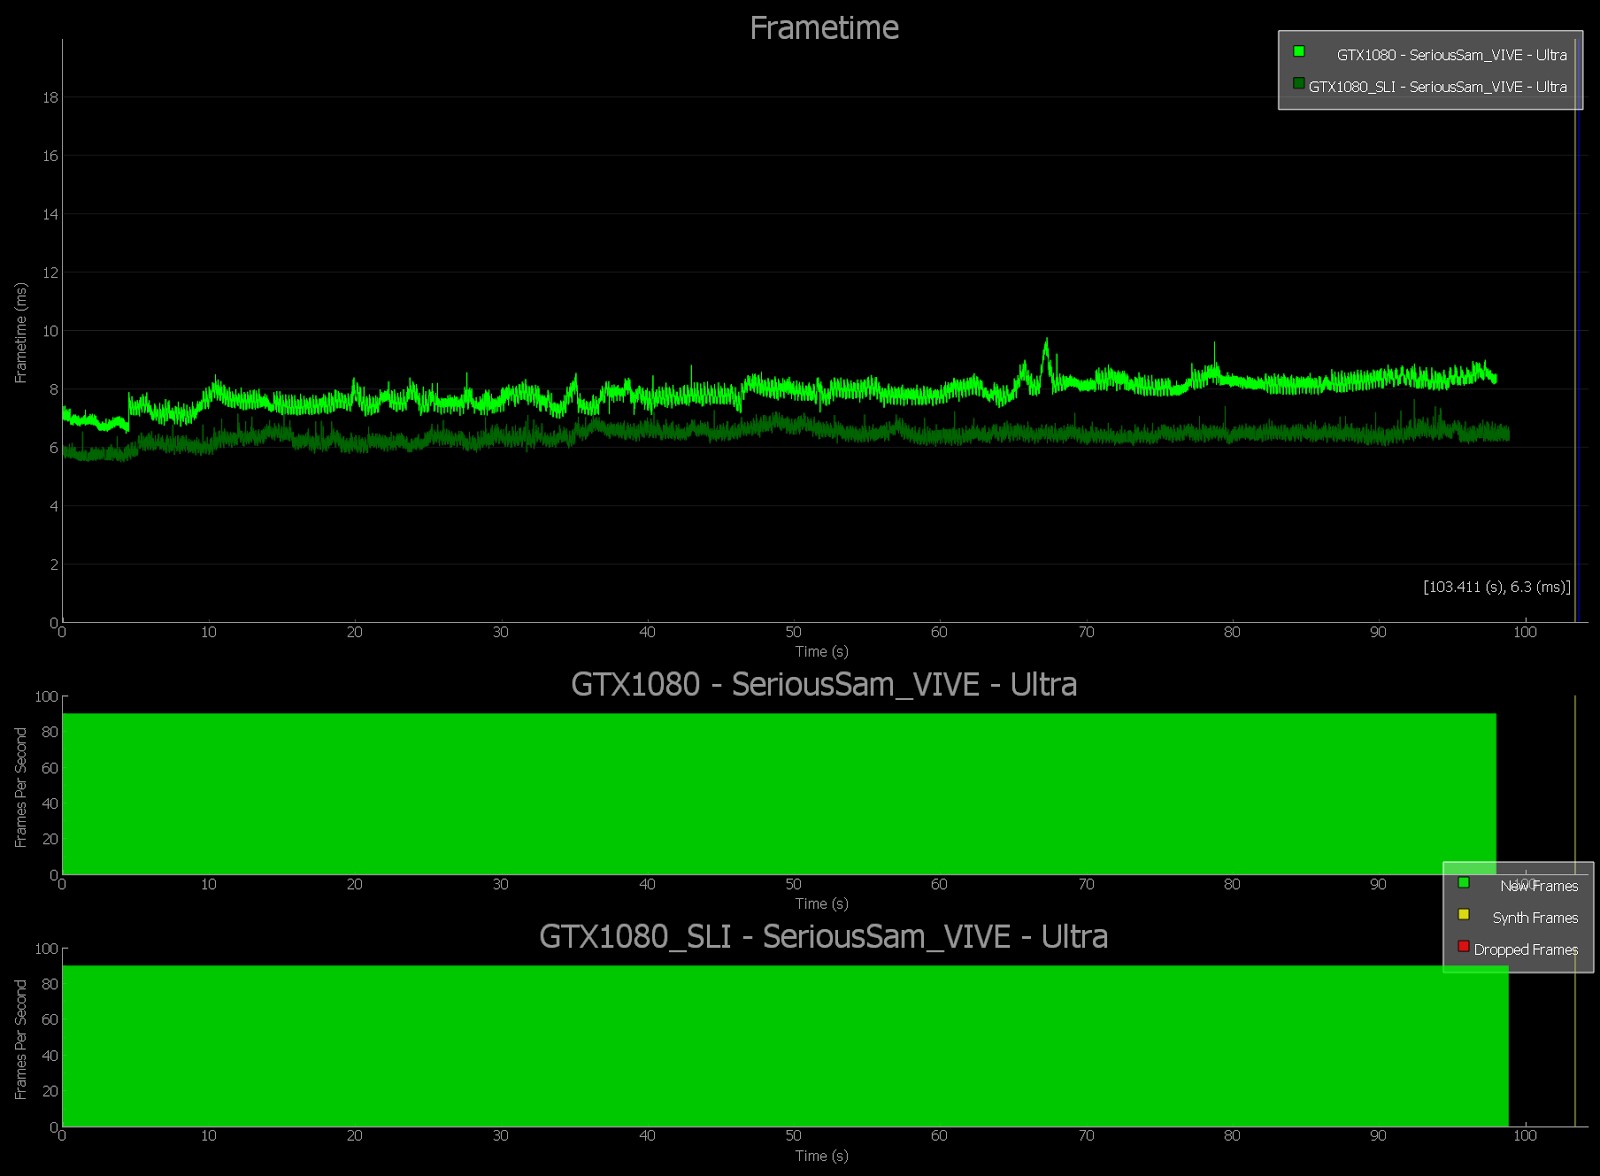
Simulating physics takes incredible processing power, and we found it by applying NVIDIA VRWorks technologies, including Multi-Res Shading and VR SLI to increase rendering performance.
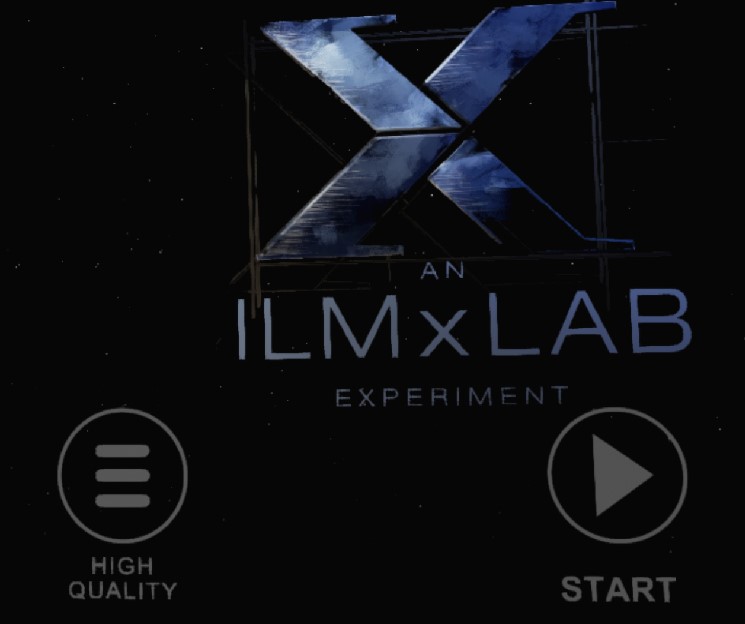
From the main menu, choose the desired preset before selecting start.
NOTE: These settings were chosen to best show VR SLI scaling.
|
 |
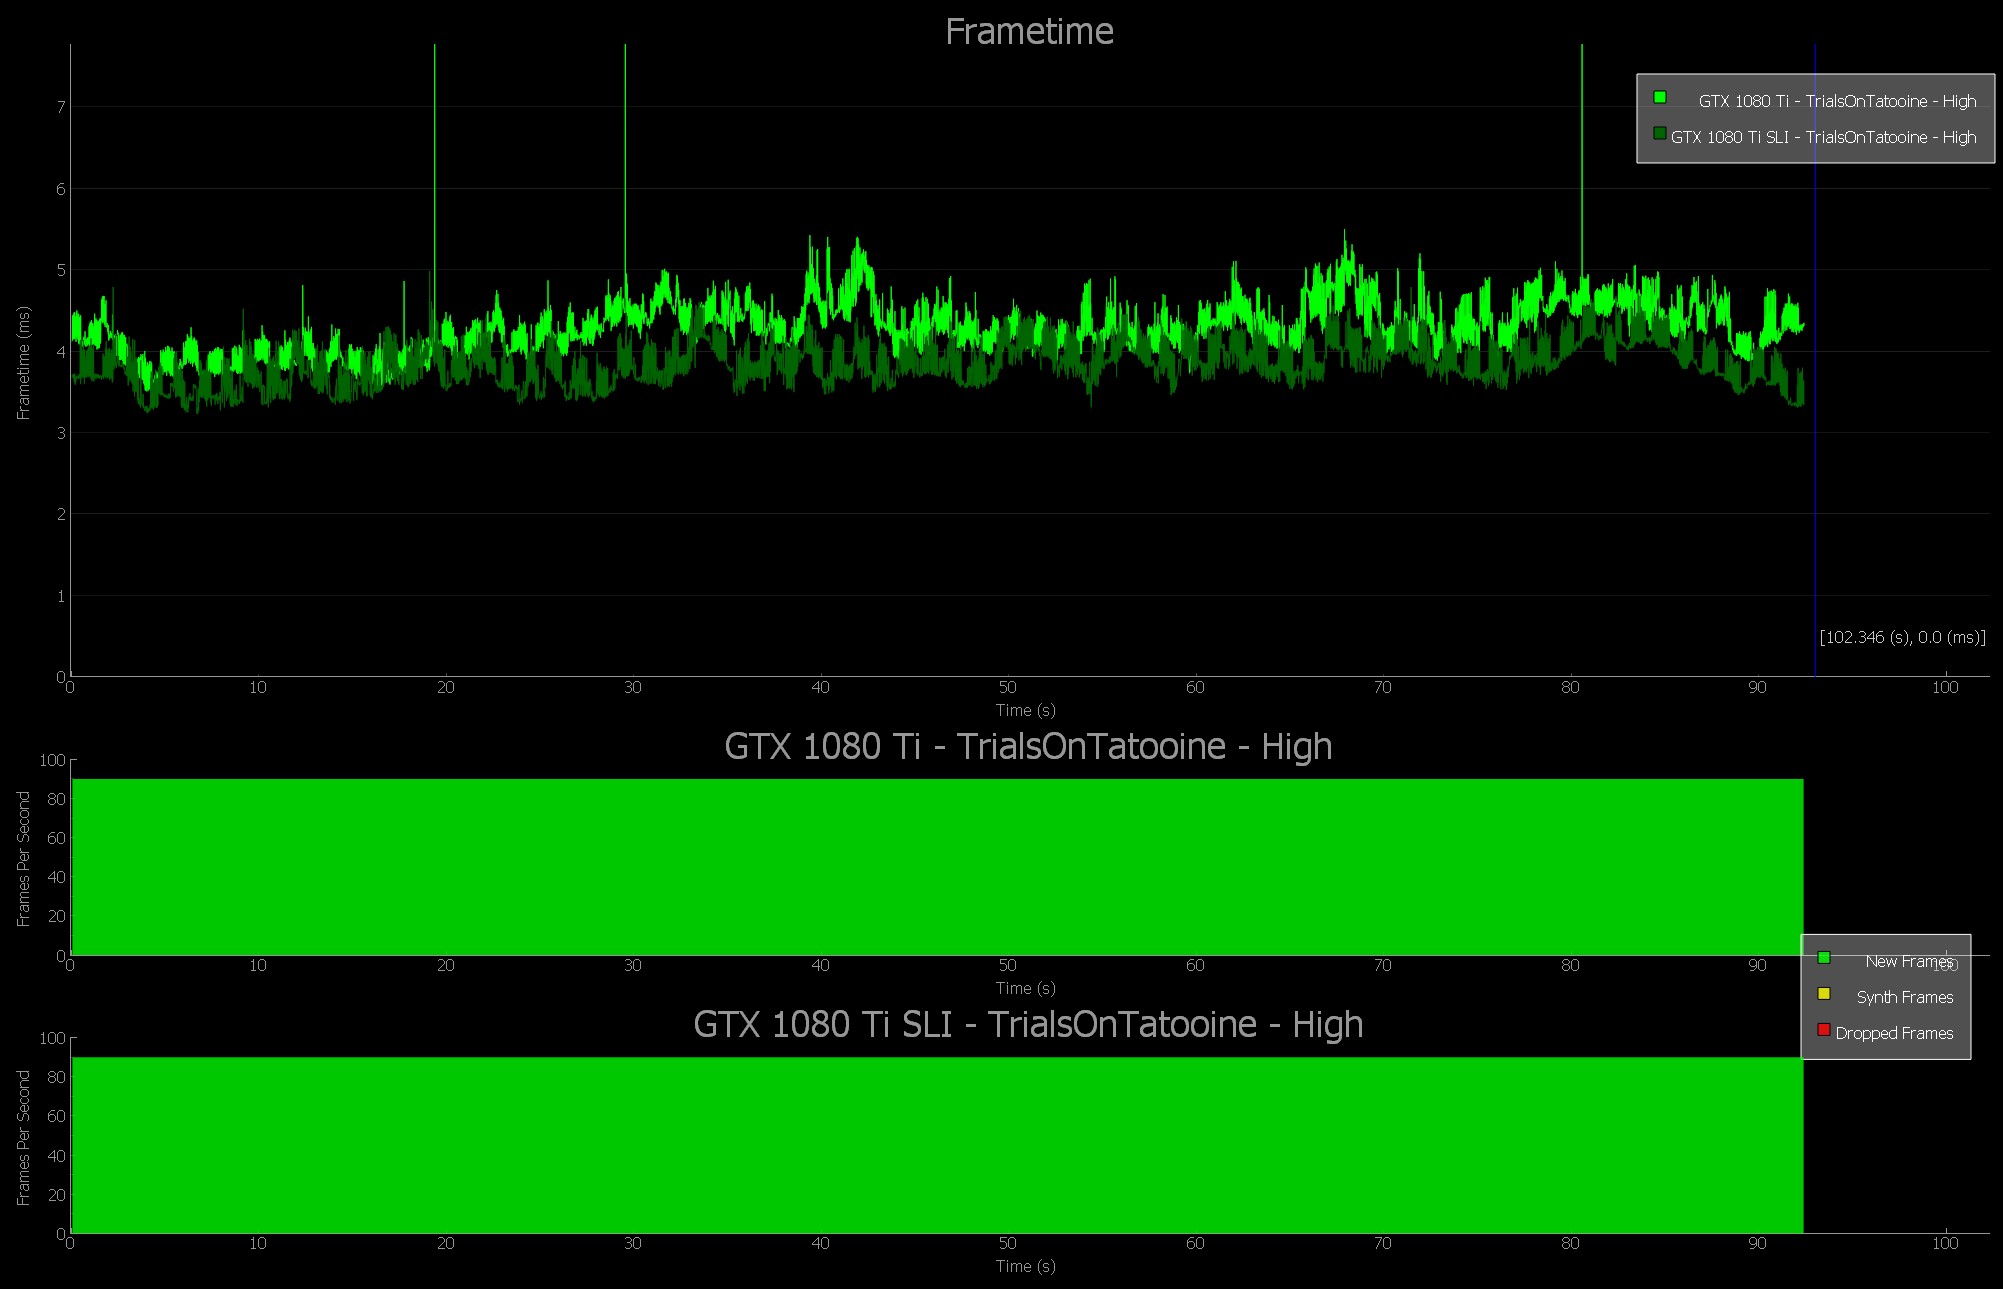
Trials on Tatooine | FCAT VR SLI Charts
The following charts show a comparison of single vs. (dual) SLI GPUs. This data was captured using the FCAT VR Software Capture tool, which captures and analyzes dropped frames and warp misses in VR gameplay. The FCAT VR Data Analyzer was used to generate the charts.
Trials on Tatooine with Single vs. SLI GTX 1080 | Ultra Settings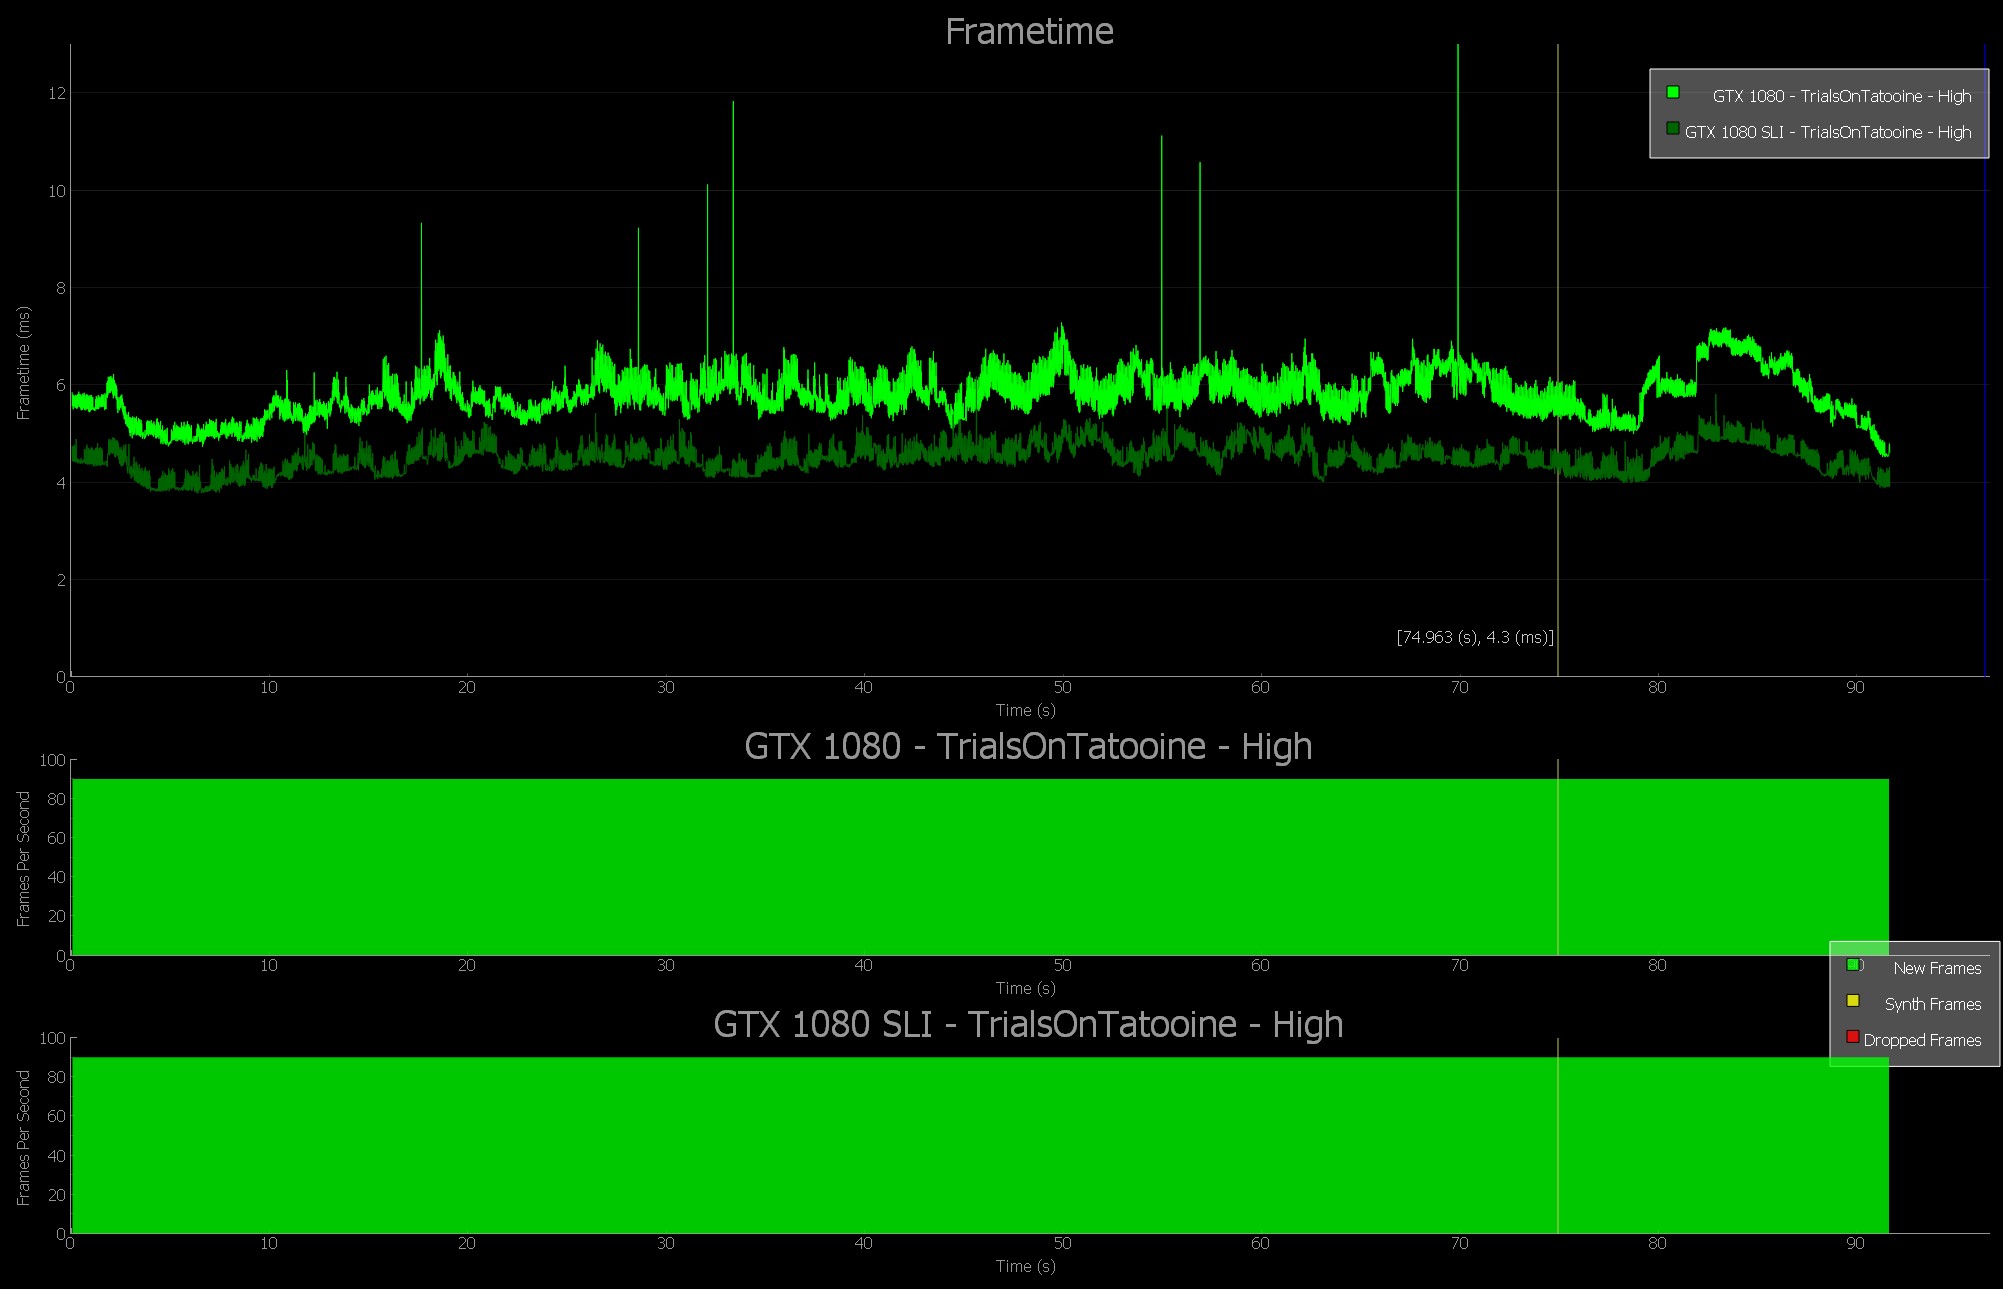
Conclusion
Before now, Virtual Reality testing relied on general benchmarking tools, synthetic tests, and hacked-together solutions, which failed to reveal the true performance of GPUs in VR games. With FCAT VR, for the first time we’re able to generate data for frametimes, dropped frames, runtime warp dropped frames, and Asynchronous Space Warp (ASW) synthesized frames, revealing stutters, undesirable interpolation, and the experience received when gaming on any GPU in the tested Virtual Reality game.
In other words, we can now see the true performance of all GPUs in Virtual Reality games, giving buyers accurate information that can inform their purchasing decisions. And for reviewers, they can accurately assess GPUs in VR for the first time, making their in-depth examinations even more helpful and authoritative.