Graph analytics, or Graph algorithms, are analytic tools used to determine the strength and direction of relationships between objects in a graph. The focus of graph analytics is on pairwise relationships between two objects at a time and structural characteristics of the graph as a whole.
Graph Analytics
What Is Graph Analytics?
Graph analytics is an emerging form of data analysis that helps businesses understand complex relationships between linked entity data in a network or graph.
Graphs are mathematical structures used to model many types of relationships and processes in physical, biological, social, and information systems. A graph consists of nodes or vertices (representing the entities in the system) that are connected by edges (representing relationships between those entities). Working with graphs is a function of navigating edges and nodes to discover and understand complex relationships and/or optimize paths between linked data in a network

There are many uses of graph network analysis, such as analyzing relationships in social networks, cyber threat detection, and identifying the people most likely to buy a product based upon shared preferences.
In the real world, nodes can be people, groups, places, or things such as customers, products, members, cities, stores, airports, ports, bank accounts, devices, mobile phones, molecules, or web pages.
Examples of edges, or relationships between nodes, include friendships, network connections, hyperlinks, roads, routes, wires, phone calls, emails, “likes,” payments, transactions, phone calls, and social networking messages. Edges can have a one-way direction arrow to represent a relationship from one node to another, as in Janet “liked” a social media post of Jeanette’s. But they can also be non-directional as in, if Bob is a Facebook friend of Alice, then Alice is also a friend of Bob.
Why Graph Analytics?
Graph analytics can be used to determine the strength and direction of relationships between objects in a graph. The focus is on relationships between two objects at a time, as well as structural characteristics of the graph as a whole. Examples of data well-suited to graphs are road networks, communications networks, social networks, web pages and links, and financial transaction data. Graph analytics has been particularly useful to achieve the following:
- Detect financial crimes such as money laundering
- Identify fraudulent transactions and activities
- Perform influencer analysis in social network communities
- Perform recommendation analysis from customers ratings or purchases.
- Identify weaknesses in power grids, water grids, and transportation networks
- Optimize routes in the airlines, retail, manufacturing industries
How Does Graph Analytics work?
Graph analytics uses graph specific algorithms such as clustering, partitioning, breadth first search, PageRank, connected components, and shortest path to analyze relationships between entities in a number of applications:
- Clustering — the grouping of objects based on their characteristics such that there is high intra-cluster similarity and low inter-cluster similarity. Applications include machine learning, data mining, statistics, image processing, and numerous physical and social science applications.
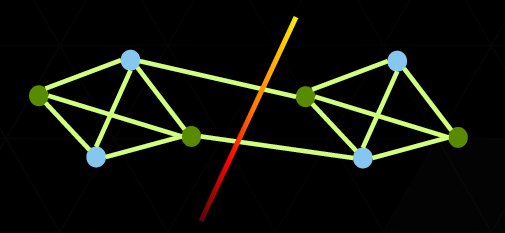
- Cutting or Partitioning — to find the cut with the fewest number of crossing edges. Applications include finding weak spots in data and communications networks and community detection in social networks.
- Search – Breadth-first search and depth-first search.

- Shortest path – to find the shortest path between two nodes of interest. Applications include social network analysis, transportation logistics, and many other optimization problems.

- Widest path – to find a path between two designated vertices in a weighted graph, maximizing the weight of the minimum-weight edge in the path. Applications include IP traffic routing and traffic-sensitive path planning.
- Connected components – A strongly connected graph is one where you can get to every node in the graph from any starting node. The strongly connected components are the maximal sub-regions of a graph for which each sub-region is strongly connected. Applications include social network analysis.

- Page Rank – a measure of popularity of webpages that’s used by Internet search for ranking them. Applications also include social network analysis, recommendation systems, and novel uses in natural science when studying the relationship between proteins and in ecological networks.

Top Graph Analytics Use Cases
Build recommendation systems. By identifying the relationships and frequencies between customers, social media, and product data, companies can build intelligent recommendation engines that respond to customers online activities in real time.
Detect fraud. Graph analytics allows you to model data relationships at scale with tremendous flexibility, letting you analyze large amounts of transactional data rapidly to identify fraud in real time.
Comply with regulatory mandates. Complying with regulations such as HIPAA, PCI/DSS, and GDPR, affects businesses throughout numerous industries. Whenever you collect personal information about customers, these regulations require you to have visibility into that data as it makes its way through various enterprise systems. With graph analytics, tracing sensitive data through enterprise systems is much easier, giving you a visual representation of the data flowing through different systems. This gives you a streamlined way to achieve regulatory compliance.
Master identity and access management (IAM). Determining who should be allowed into sensitive applications and data—both cloud-based and on-premise—is a complex process. Graph analytics enables a more robust, real-time, cross-platform management of all necessary data to determine relationships and accelerate safe and secure IAM.
Get insight into supply-chain efficiency. As a result of globalization, business supply chains are more complex than ever. Graph analytics lets you model these complex relationships, and get much greater transparency into any inefficiencies in supply chain operations.

Build recommendation systems

Detect Fraud
Accelerating Graph Analytics with GPUs
The computational requirements of large-scale graph processing for cyber analytics, genomics, social network analysis, and other fields demand powerful and efficient computing performance.
GPUs provide a great way to accelerate data-intensive analytics and graph analytics in particular, because of the massive degree of parallelism and the memory access bandwidth advantages. GPUs feature a massively parallel architecture, consisting of thousands of small cores designed for handling multiple tasks simultaneously, that are well suited for the computational task of “for every X do Y”, which can apply to sets of vertices or edges within a large graph.

Accelerating NetworkX with RAPIDS cuGraph
NVIDIA RAPIDS™ cuGraph provides an accelerated graph analytics library that integrates the RAPIDS ecosystem with the popular python graphics library NetworkX. The vision of RAPIDS cuGraph is to make graph analysis ubiquitous to the point that users just think in terms of analysis and not technologies or frameworks.
The compute power of the latest NVIDIA GPUs makes graph analytics much faster. Moreover, the internal memory speed within a GPU allows cuGraph to rapidly switch the data structure to best suit the needs of the analytic, rather than being restricted to a single data structure.
RAPIDS’s graph algorithms accelerate analysis of large graphs by over 1000X by making efficient use of the massive parallelism available in GPUs. Explore up to 200 million edges on a single A100 GPU and scale to billions of edges on DGX A100 clusters.
NVIDIA GPU-Accelerated, End-to-End Data Science
NVIDIA RAPIDS combines the ability to perform high-speed ETL, graph analytics, machine learning, and deep learning. This suite of open-source software libraries and APIs for executing data science pipelines entirely on GPUs can reduce training times from days to minutes. It relies on NVIDIA CUDA® primitives for low-level compute optimization, but exposes that GPU parallelism and high memory bandwidth through user-friendly Python interfaces.
RAPIDS cuGraph seamlessly integrates into the RAPIDS data science ecosystem to enable data scientists to easily call graph algorithms using data stored in a GPU DataFrame. With the RAPIDS GPU DataFrame, data can be loaded onto GPUs using a Pandas-like interface, and then used for various connected machine learning and graph analytics algorithms without ever leaving the GPU. This level of interoperability is made possible through libraries like Apache Arrow. It improves acceleration for end-to-end pipelines—from data prep to machine learning to deep learning. RAPIDS and DASK allow cuGraph to scale to multiple GPUs to support multi-billion edge graphs.
Next Steps
Find out more about:
- Beginner's Guide to GPU Accelerated Graph Analytics in Python
- GPU-Accelerated Data Science with RAPIDS | NVIDIA
- Georgia Tech, UC Davis, Texas A&M Join NVAIL Program with Focus on Graph Analytics
- Machine Learning
- Applications of Graph Algorithms or Graph Analytics
- NVIDIA RAPIDS cuGraph: Making Graph Analysis Ubiquitous
- Tag: Graph Analytics (Blogs)