K-means is a clustering algorithm—one of the simplest and most popular unsupervised machine learning (ML) algorithms for data scientists.
K-Means Clustering Algorithm
What is K-Means?
Unsupervised learning algorithms attempt to ‘learn’ patterns in unlabeled data sets, discovering similarities, or regularities. Common unsupervised tasks include clustering and association. Clustering algorithms, like K-means, attempt to discover similarities within the dataset by grouping objects such that objects in the same cluster are more similar to each other than they are to objects in another cluster. The grouping into clusters is done using criteria such as smallest distances, density of data points, graphs, or various statistical distributions.
K-means groups similar data points together into clusters by minimizing the mean distance between geometric points. To do so, it iteratively partitions datasets into a fixed number (the K) of non-overlapping subgroups (or clusters) wherein each data point belongs to the cluster with the nearest mean cluster center.
Why K-Means?
K-means as a clustering algorithm is deployed to discover groups that haven’t been explicitly labeled within the data. It’s being actively used today in a wide variety of business applications including:
- Customer segmentation: Customers can be grouped in order to better tailor products and offerings.
- Text, document, or search results clustering: grouping to find topics in text.
- Image grouping or image compression: groups similar in images or colors.
- Anomaly detection: finds what isn’t similar—or the outliers from clusters
- Semi-supervised learning: clusters are combined with a smaller set of labeled data and supervised machine learning in order to get more valuable results.
How K-Means Works
The K-means algorithm identifies a certain number of centroids within a data set, a centroid being the arithmetic mean of all the data points belonging to a particular cluster. The algorithm then allocates every data point to the nearest cluster as it attempts to keep the clusters as small as possible (the ‘means’ in K-means refers to the task of averaging the data or finding the centroid). At the same time, K-means attempts to keep the other clusters as different as possible.
In practice it works as follows:
- The K-means algorithm begins by initializing all the coordinates to “K” cluster centers. (The K number is an input variable and the locations can also be given as input.)
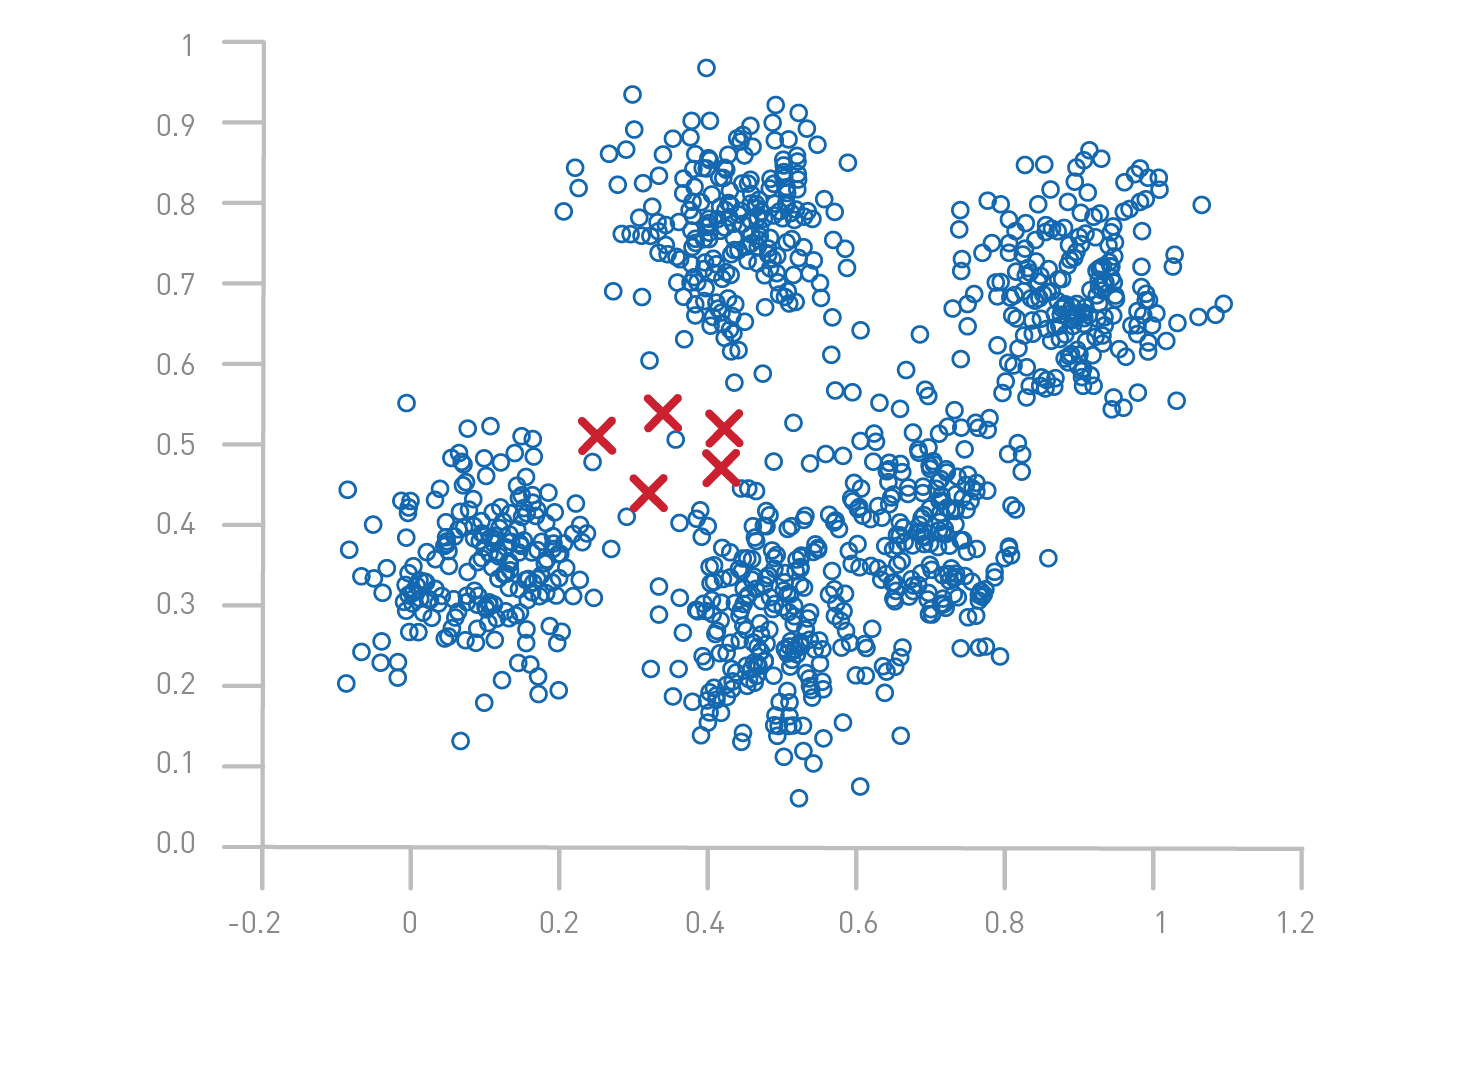
- With every pass of the algorithm, each point is assigned to its nearest cluster center.

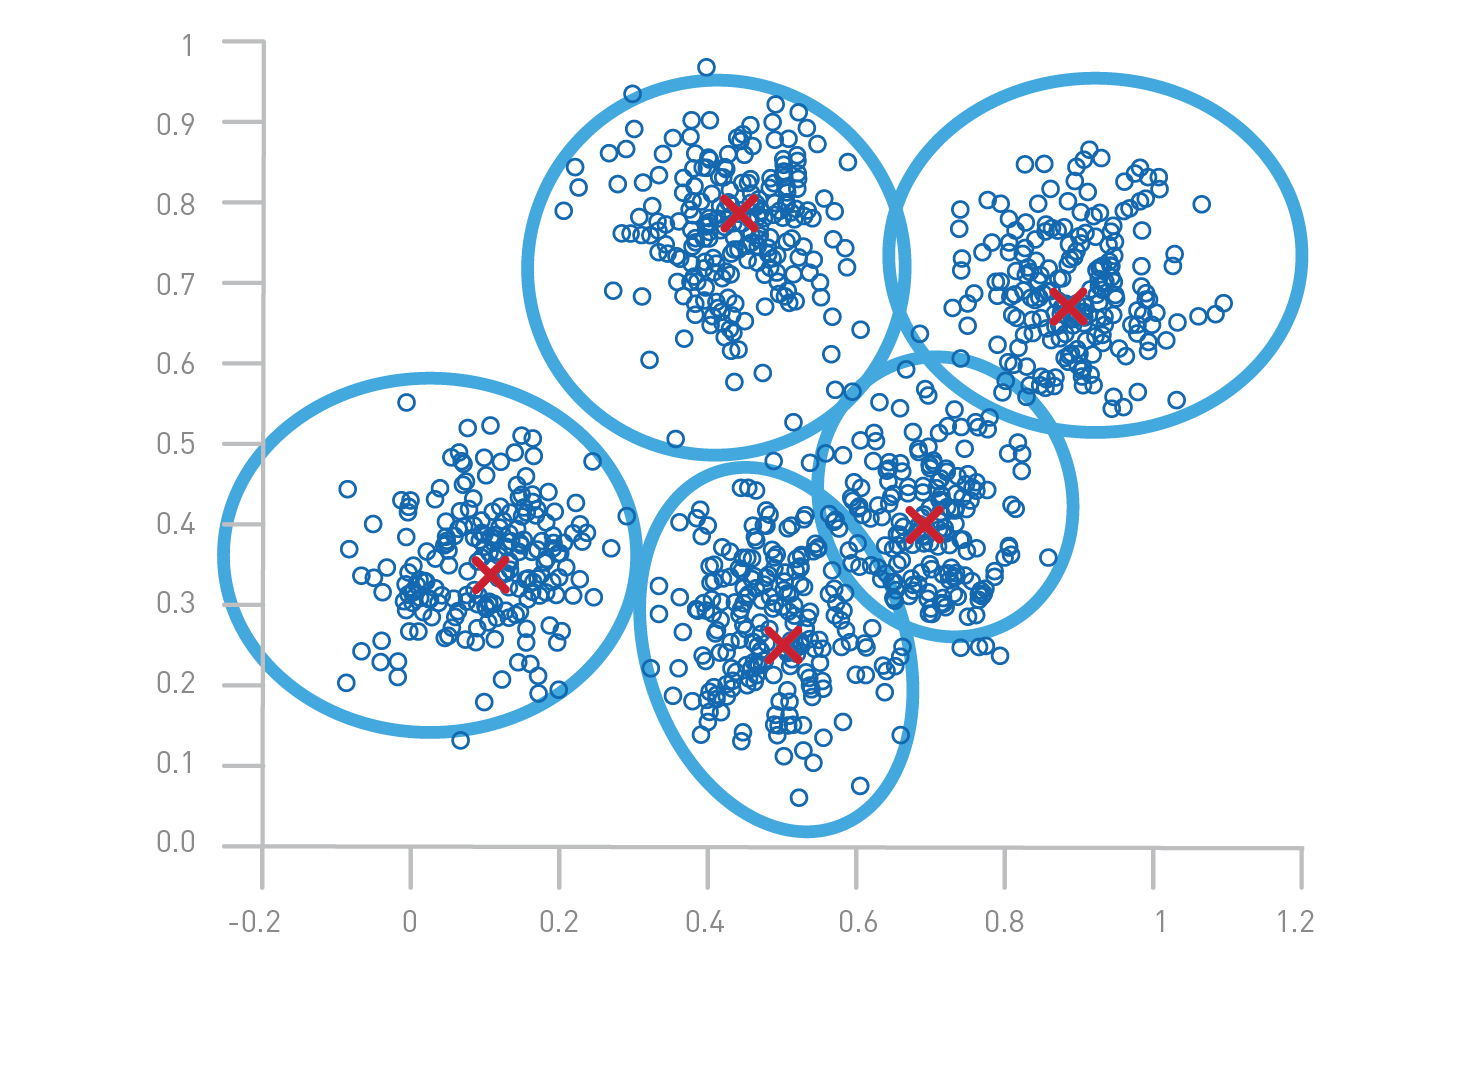
- The cluster centers are then updated to be the “centers” of all the points assigned to it in that pass. This is done by re-calculating the cluster centers as the average of the points in each respective cluster.
- The algorithm repeats until there’s a minimum change of the cluster centers from the last iteration.
K-means is very effective in capturing structure and making data inferences if the clusters have a uniform, spherical shape. But if the clusters have more complex geometric shapes, the algorithm does a poor job of clustering the data. Another shortcoming of K-means is that the algorithm does not allow data points distant from one another to share the same cluster, regardless of whether they belong in the cluster. K-means does not itself learn the number of clusters from the data, rather that information must be pre-defined. And finally, when there is overlapping between or among clusters, K-means cannot determine how to assign data points where the overlap occurs.
K-Means for Data Scientists
Owing to its intrinsic simplicity and popularity in unsupervised machine learning operations, K-means has gained favor among data scientists. Its applicability in data mining operations allows data scientists to leverage the algorithm to derive various inferences from business data and enable more accurate data-driven decision-making, the limitations of the algorithm notwithstanding. It’s widely considered among the most business-critical algorithms or data scientists.
Accelerating Clustering with GPUs
Clustering plays a critical role in a wide variety of applications, but it’s now facing the computational challenge due to the continuously increasing data volume. Parallel computing with GPUs is one of the most promising solutions to overcome the computational challenge.
Architecturally, the CPU is composed of just a few cores with lots of cache memory that can handle a few software threads at a time. In contrast, a GPU is composed of hundreds of cores that can handle thousands of threads simultaneously. GPUs provide a great way to accelerate data-intensive analytics because of the massive degree of parallelism and the memory access bandwidth advantages.

GPU-Accelerated, End-to-End Data Science
The RAPIDS™ suite of open-source software libraries, built on CUDA, gives you the ability to execute end-to-end data science and analytics pipelines entirely on GPUs, while still using familiar python interfaces like Pandas and Scikit-Learn APIs.
RAPIDS’s cuML machine learning algorithms and mathematical primitives follow the familiar scikit-learn-like API. Popular algorithms like K-means, XGBoost, and many others are supported for both single-GPU and large data center deployments. For large datasets, these GPU-based implementations can complete 10-50X faster than their CPU equivalents.
cuML-MG combines the ease of use of the Dask framework with the highly-optimized OpenUCX and NCCL libraries for performance-critical data transfers. k-Means clustering is the first algorithm built on this library. It provides a familiar, scikit-learn-style API, but scales nearly linearly across GPUs and nodes using Ethernet or Infiniband. Across a pair of DGX-1 servers, k-Means-MG can cut the run time for a large clustering problem from 630 seconds on CPU to 7.1 seconds on GPU .

With the RAPIDS GPU DataFrame, data can be loaded onto GPUs using a Pandas-like interface, and then used for various connected machine learning and graph analytics algorithms without ever leaving the GPU. This level of interoperability is made possible through libraries like Apache Arrow. This allows acceleration for end-to-end pipelines—from data prep to machine learning to deep learning.
RAPIDS supports device memory-sharing between many popular data science libraries. This keeps data on the GPU and avoids costly copying back and forth to host memory.

Next Steps
Find out about :
- Combining Speed & Scale to Accelerate K-Means in RAPIDS cuML
- Accelerating Single-Cell Genomic Analysis using RAPIDS
- Cluster Analysis
- Building an Accelerated Data Science Ecosystem: RAPIDS Hits Two Years
- GPU-Accelerated Data Science with RAPIDS | NVIDIA
- RAPIDS Accelerates Data Science End-to-End
- NVIDIA Developer Blog | Technical content: For developers, by developers